
Aggregate demand diagram
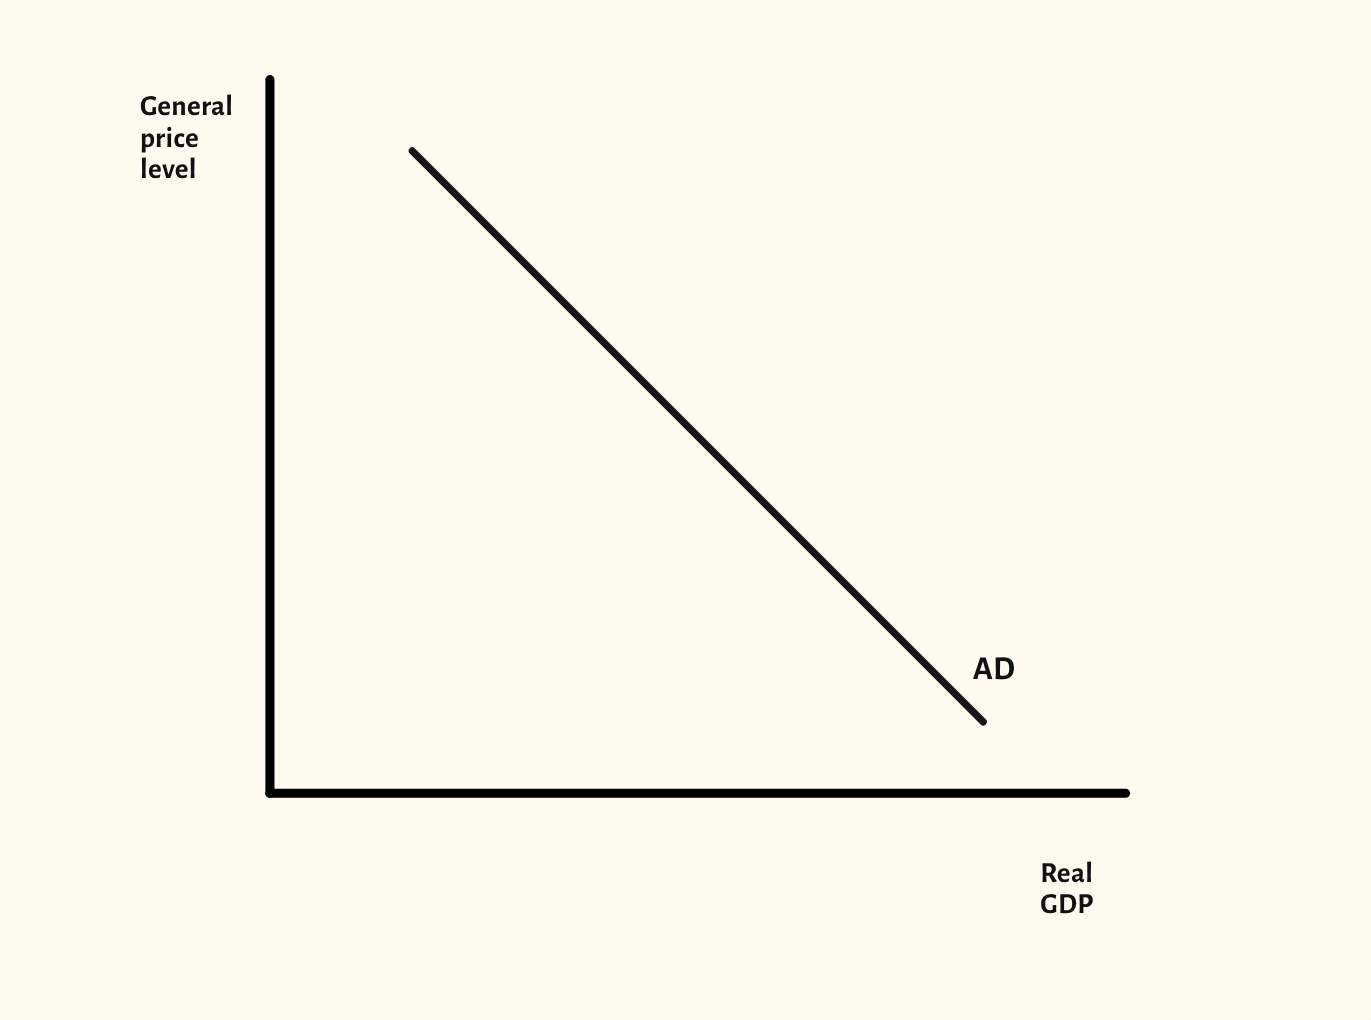
The aggregate demand curve on its own, with movements along it and shifts of the whole curve.
Included in the school licence.
Teaching notes
Before AD meets AS, it is worth showing the aggregate demand curve on its own, so the class sees that a change in the price level moves the economy along AD and a change in a component of spending shifts the whole curve.
The scenarios show a movement along AD, an increase in AD and a decrease in AD, with the axes labelled as examiners expect: general price level and real GDP.
In a lesson, try giving the class changes to consumption, investment, government spending and net exports, and asking which shift AD and which way, before you show the shift. It leads straight into the AD/AS diagram.
What you can show
Each of these is one click in the diagram's Scenarios menu, and each starts from the plain diagram.
- Movement along AD
- Increase in AD
- Decrease in AD
Exam boards
On the Edexcel A, Edexcel B, AQA, OCR, Eduqas, WJEC, Cambridge International and Edexcel International A-level specifications, drawn in exam style: black lines, clear labels and no grid.