
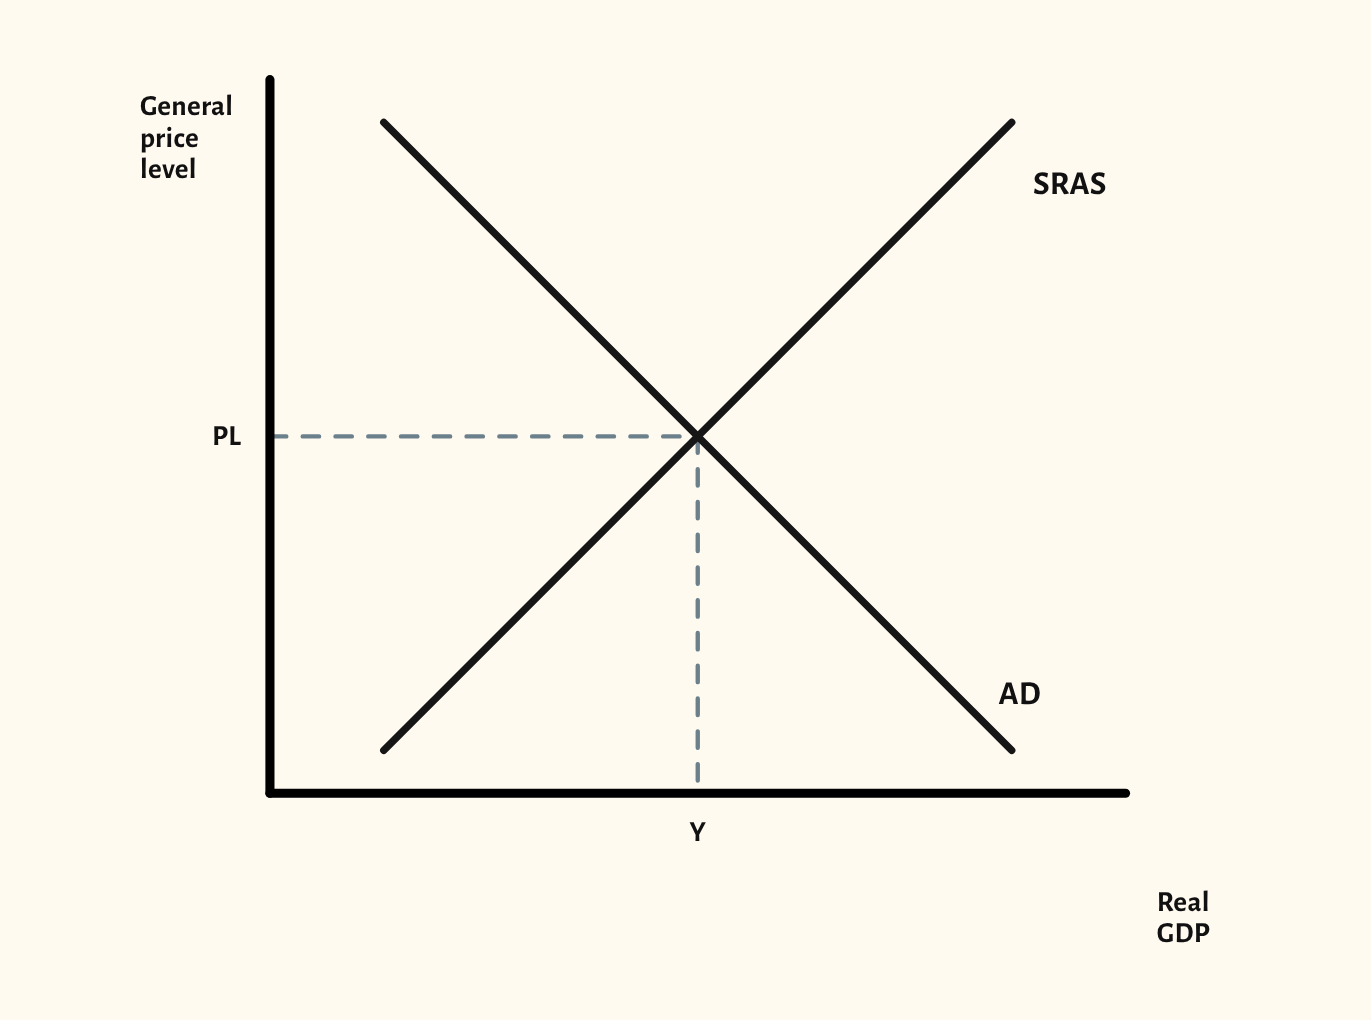
AD/AS diagram
Shift aggregate demand or short-run aggregate supply and show the new price level and real GDP, then compare the Keynesian and neo-classical long run.
Free, with no account needed.
Teaching notes
The AD/AS diagram is the backbone of A-level macroeconomics: growth, inflation, unemployment and policy all come back to it. Drag AD or SRAS to shift it, and the diagram marks the new price level and real GDP on the axes.
The long-run models are where exam answers most often go wrong, so both are built in. The Keynesian long-run aggregate supply curve lets you show AD rising with spare capacity, as costs start to rise, and at full capacity, so the class sees why the same rise in AD has different effects. The neo-classical model shows a vertical LRAS, with growth as a shift of LRAS to the right.
In a lesson, try asking the class to predict the effect of a rise in AD at each point on the Keynesian curve before you step through the three scenarios. Present mode shows the diagram full screen, and you can copy it into a worksheet or slide.
What you can show
Each of these is one click in the diagram's Scenarios menu, and each starts from the plain diagram.
- Increase in AD
- Decrease in AD
- Multiplier – investment rises
- Increase in SRAS
- Decrease in SRAS
- Keynesian – AD rises with spare capacity
- Keynesian – AD rises as costs rise
- Keynesian – AD rises at full capacity
- Classical – increase in LRAS
Exam boards
On the Edexcel A, Edexcel B, AQA, OCR, Eduqas, WJEC, Cambridge International and Edexcel International A-level specifications, drawn in exam style: black lines, clear labels and no grid.