
Welcome back
For A-level Economics teachers
Show your class what happens when the curve shifts
33 exam-style diagrams for A-level Economics, with 243 ready-made scenarios. Drag the curves, step through each scenario and present it full screen.
Try it free Prices for schools
Four diagrams free to use. No sign-up. Opens in your browser.
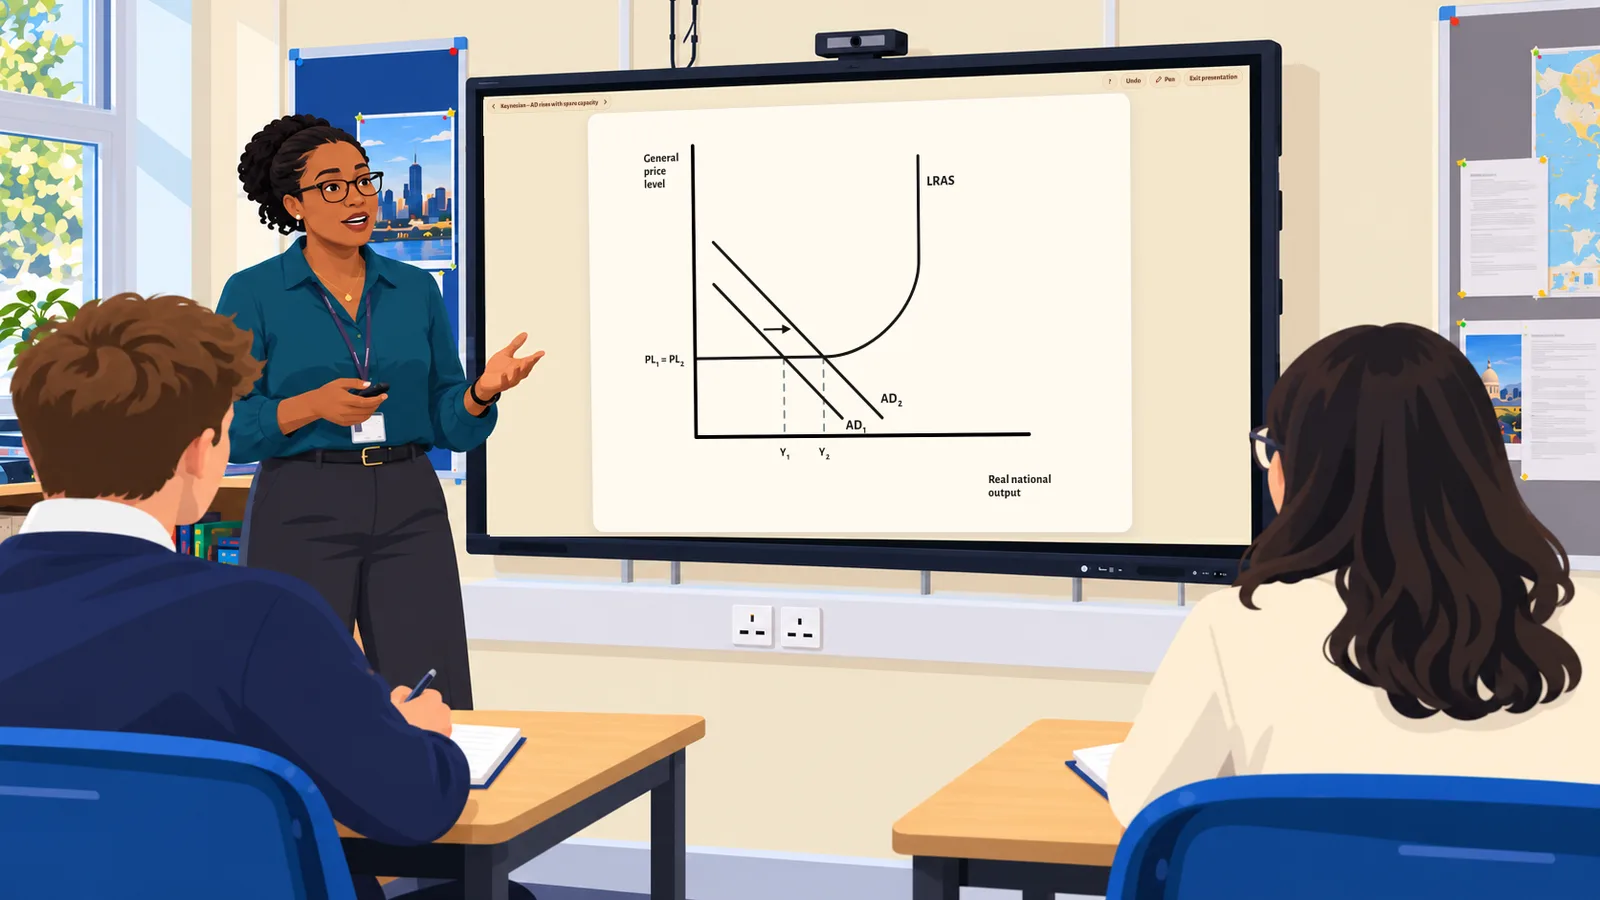
- For Edexcel, AQA, OCR and more
- Accessibility settings and coloured backgrounds
- Four diagrams free to use, no sign-up
- £99 a year for your department
Try it yourself
This is Market Equilibrium, one of CueCurve's 33 diagrams, and one of the four that are free. Drag a curve and watch the price change.
- Drag with a mouse, a finger or the arrow keys
- Prices, quantities and guide lines follow
- Arrows show which way each curve has shifted
Keyboard graph controls: press Enter or Space to select a focused graph object. In Shift mode, use Left and Right Arrow to move an ordinary curve, or Up and Down Arrow to move a policy curve or price line. In Elasticity mode, use Left and Right Arrow to rotate a selected curve. Hold Shift with an arrow key for a larger step.
Market Equilibrium. Price on the vertical axis and quantity on the horizontal axis. Curves: D1 and S1. Equilibrium at price P1 and quantity Q1. No curve is selected.
Drawn the way your students have to draw them
Black lines on a plain background, as in the exam. No grid lines, no sliders, no extra numbers: just the relationships the diagram shows.
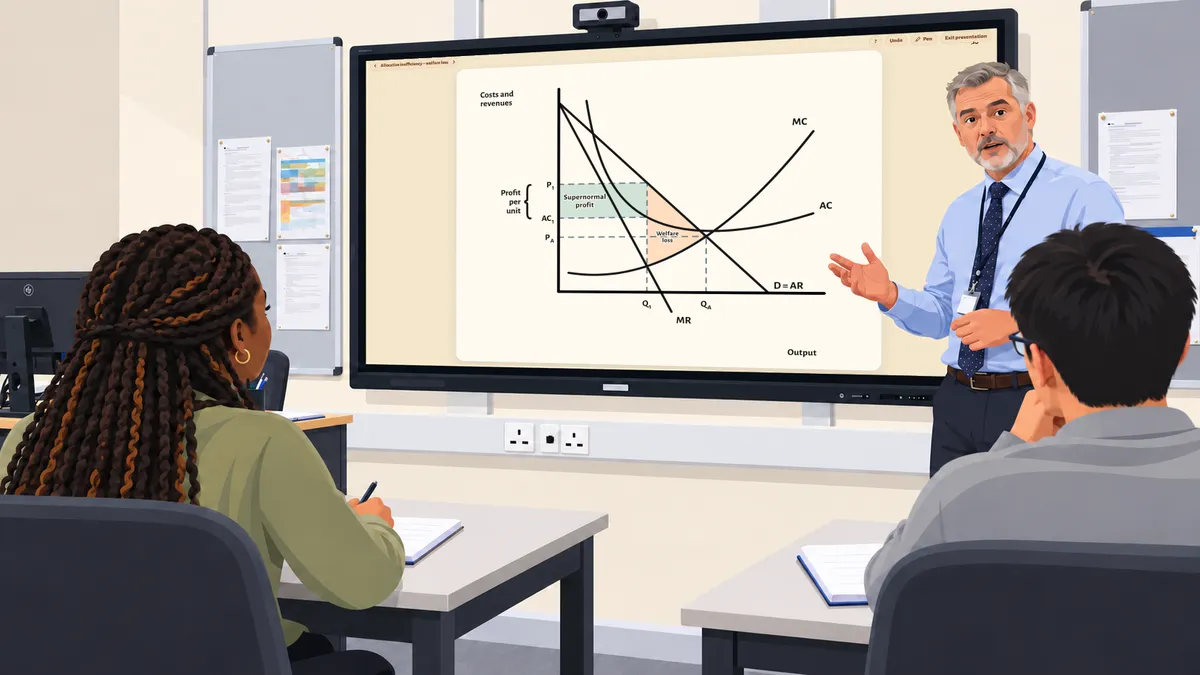
Features
Six features that make teaching easier
Everything you need at the front of the class, from your exam board's order to drawing the diagram live.
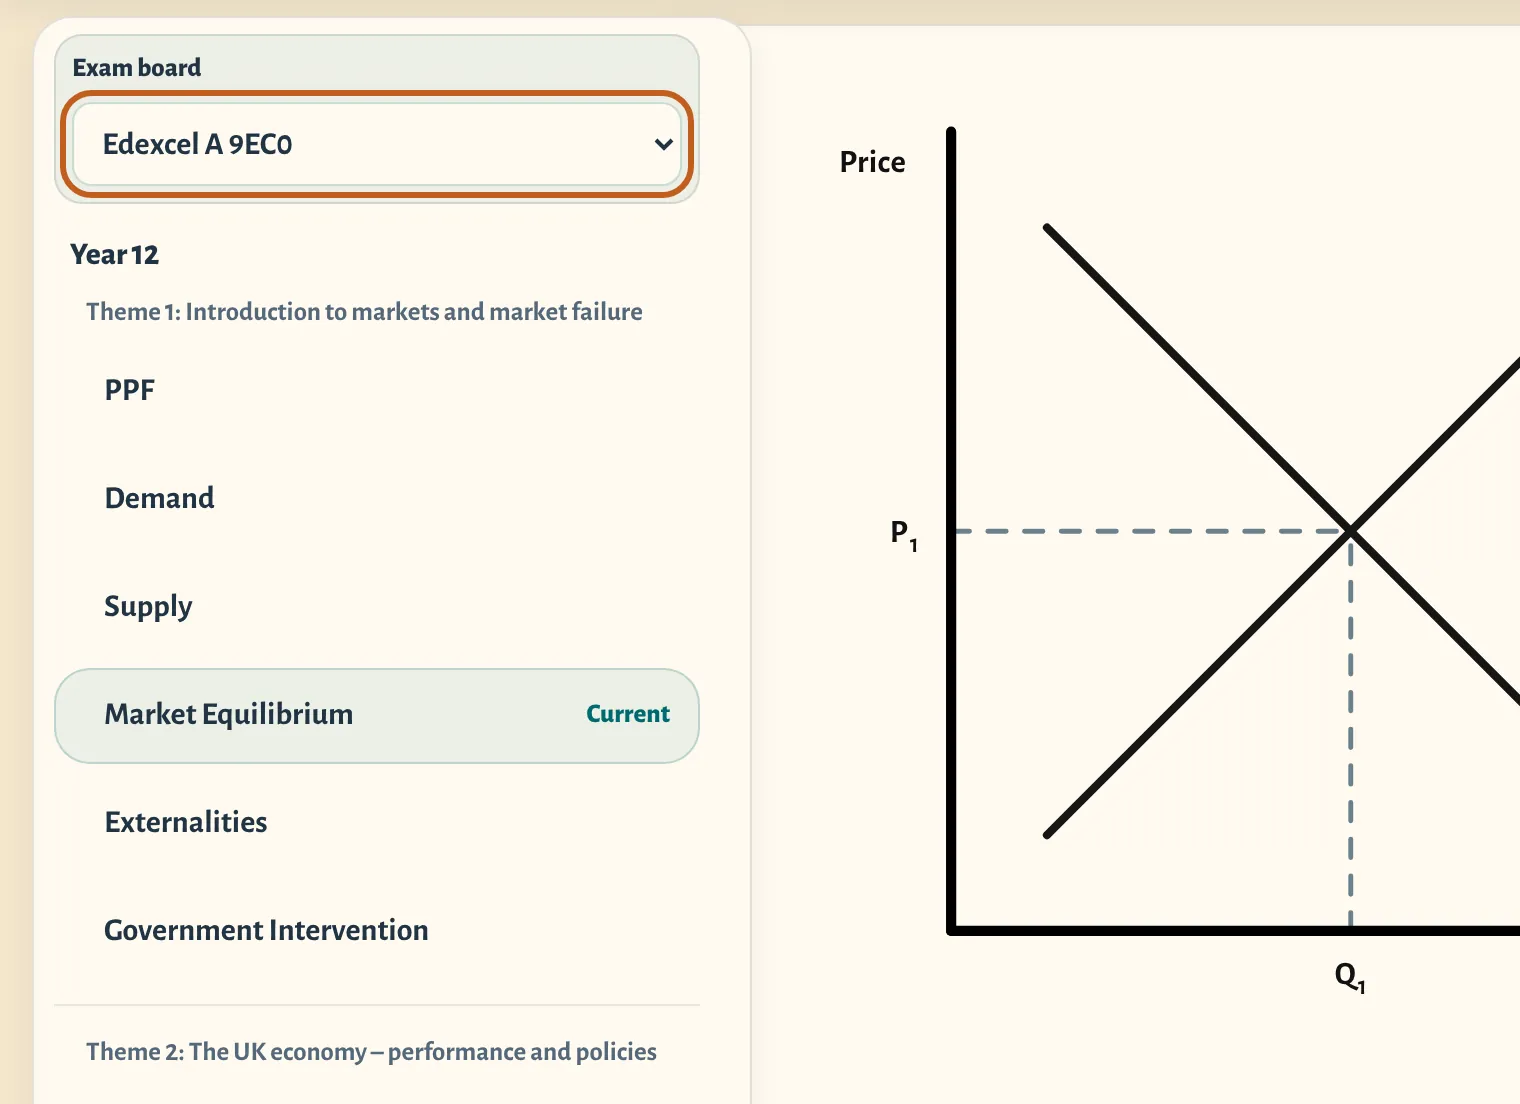
Ready for your exam board
Choose your specification and CueCurve lists its diagrams in its order, under its own headings, using its terms: Edexcel A and B, AQA, OCR, Eduqas, WJEC, Cambridge International and Edexcel International.
Every diagram is checked against each board's specification, mark schemes and examiner reports. How CueCurve checks its diagrams.
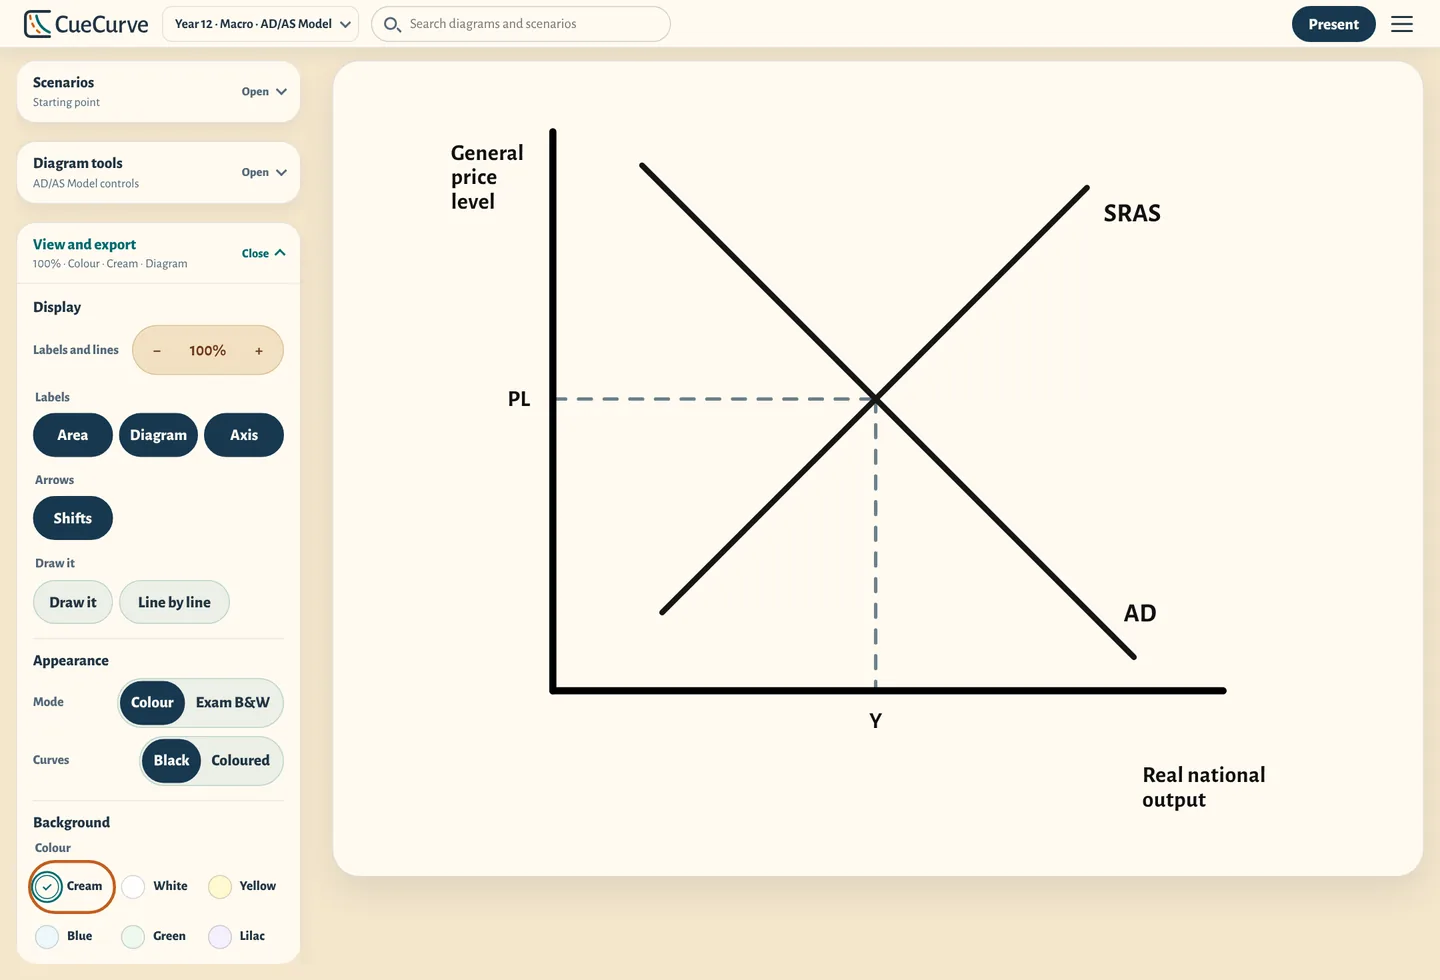
Accessibility settings for clearer classroom presentation
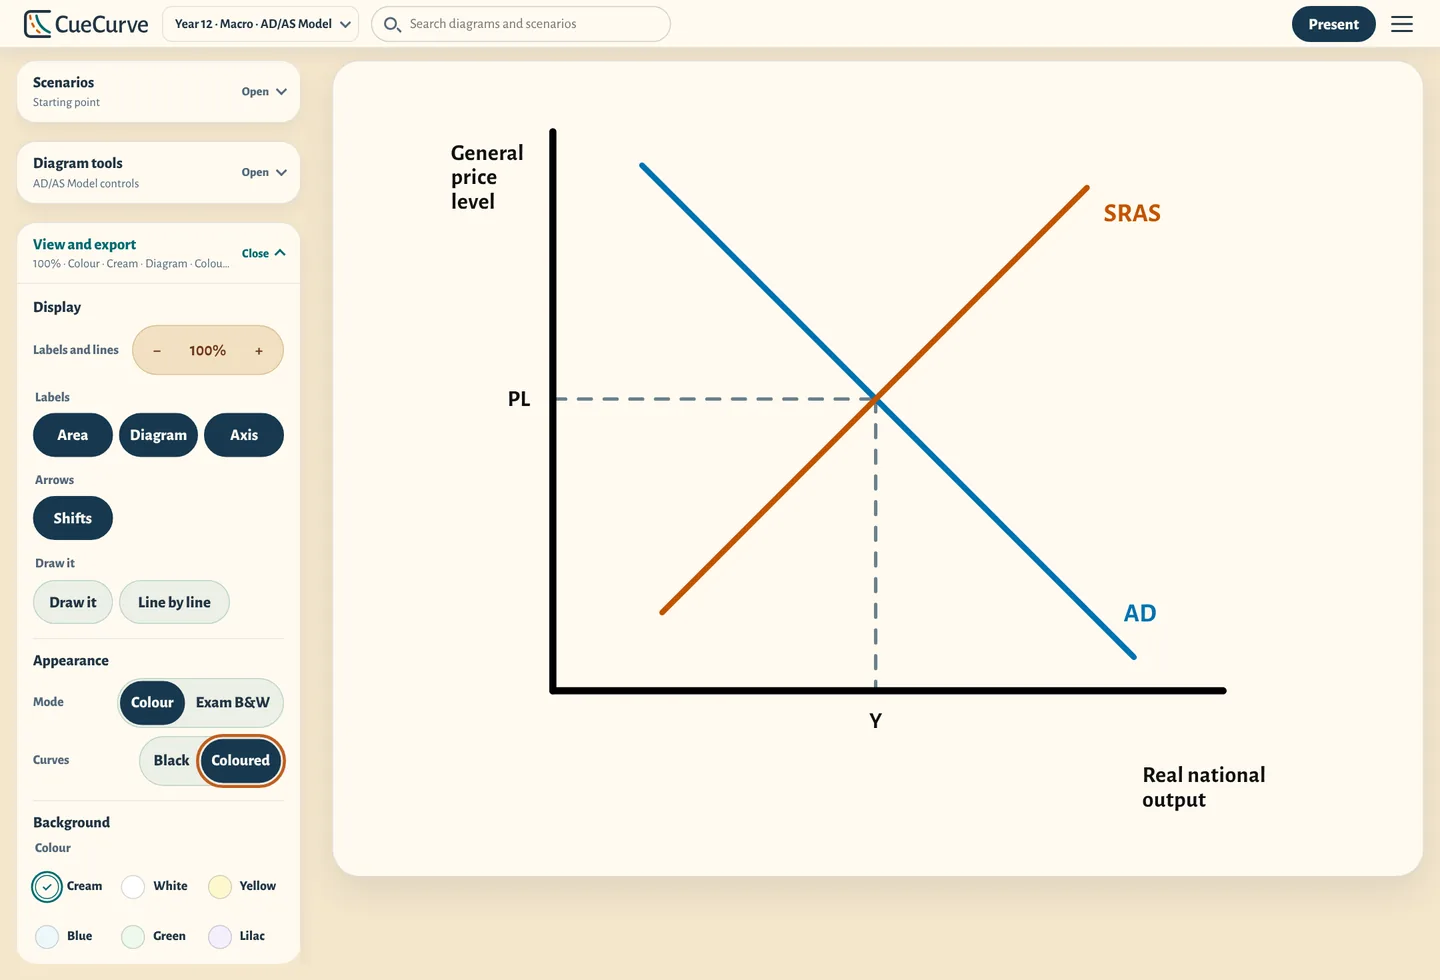
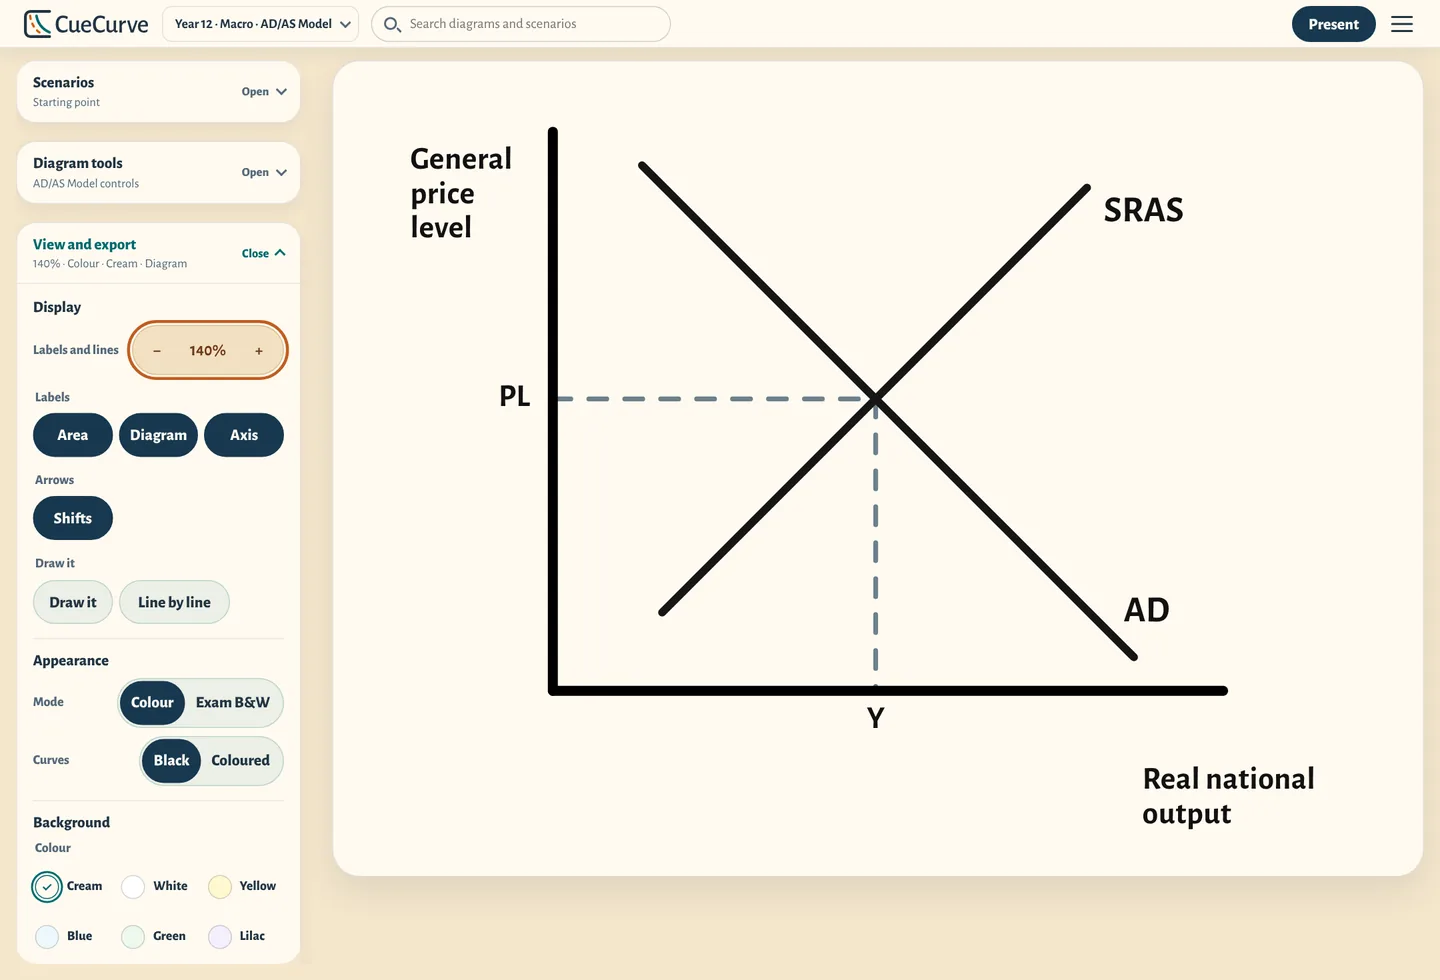
Adjust the background tint, label size and curve colours to make diagrams easier to see. CueCurve remembers your display choices.
- Six background colours, for the diagram or the whole screen
- Labels and lines from 80% up to 160%
- Curve colours tested for colour blindness, or keep them black
- Use it with a keyboard alone, zoomed in, or with less movement
We test CueCurve against WCAG 2.2 AA, the standard UK public-sector websites are expected to meet, and say openly what's still being fixed. Read our accessibility statement.
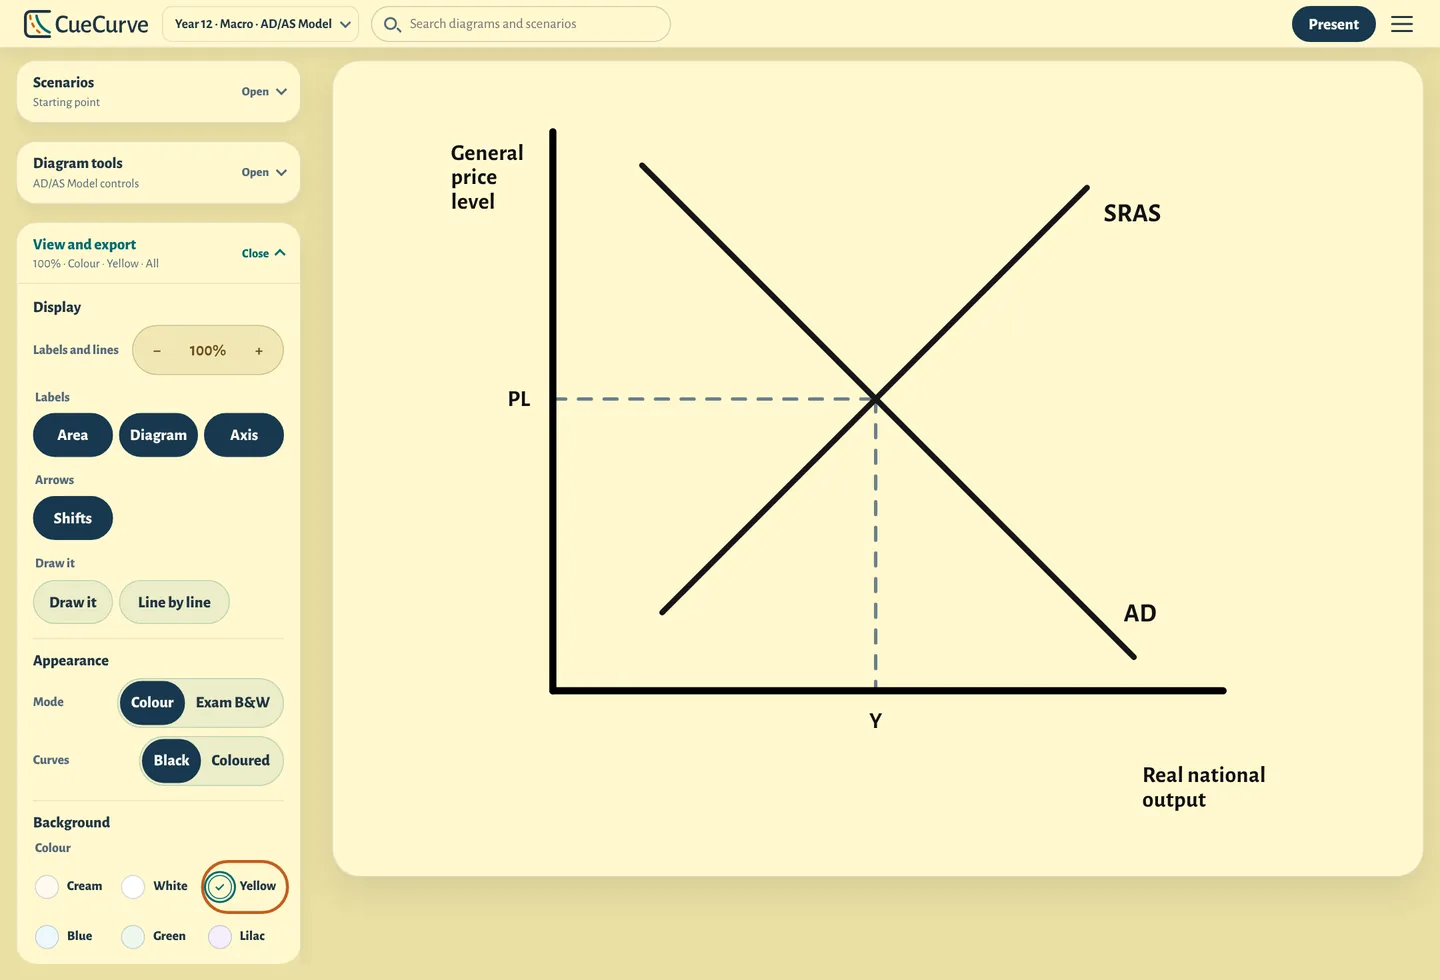
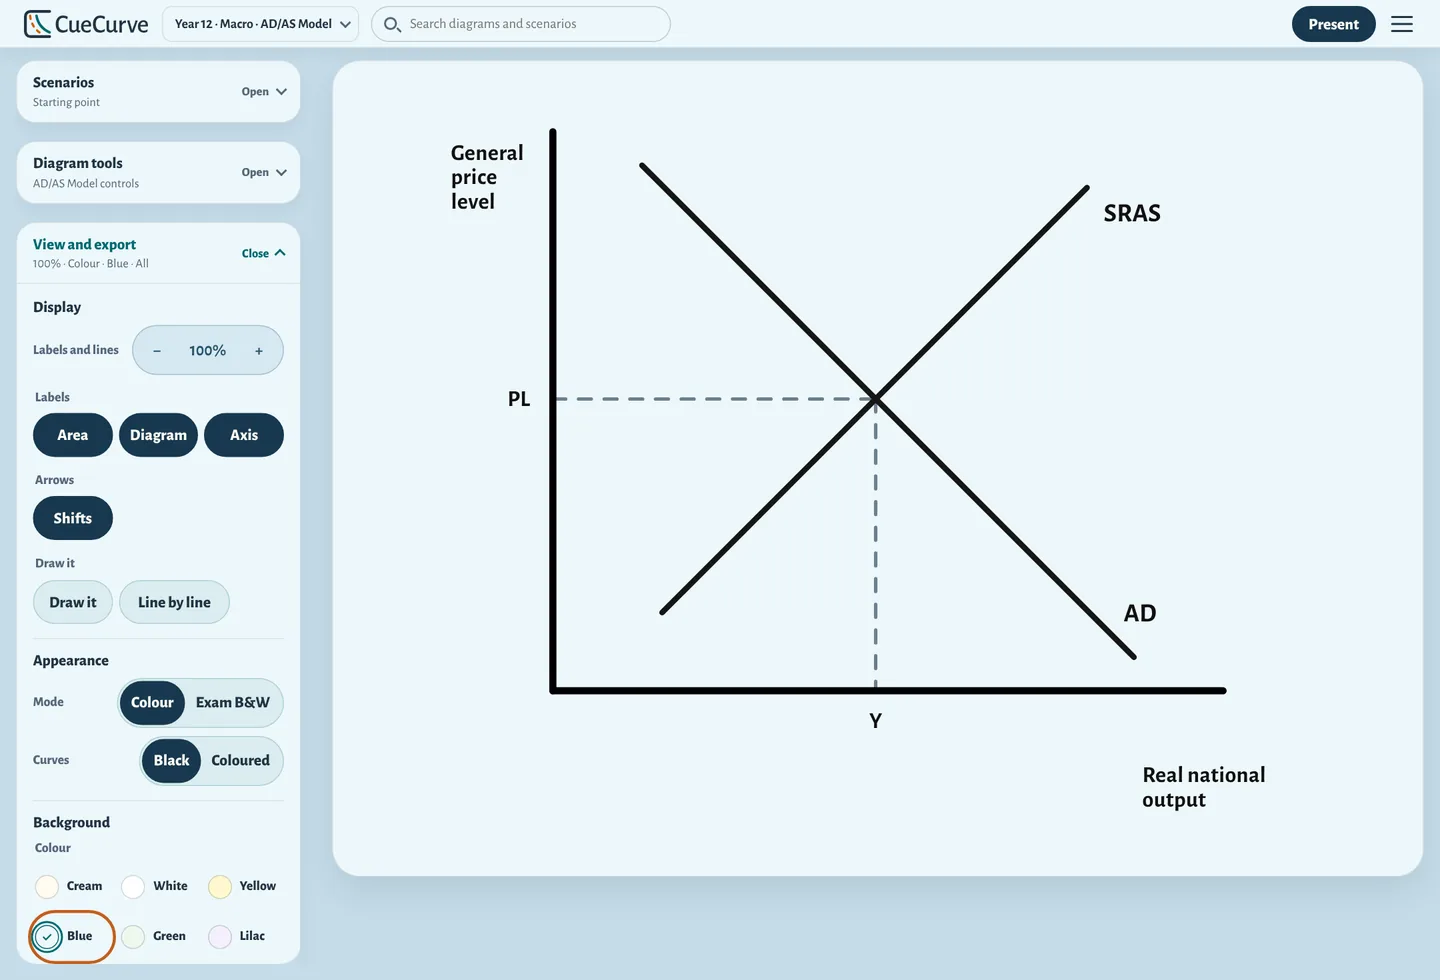
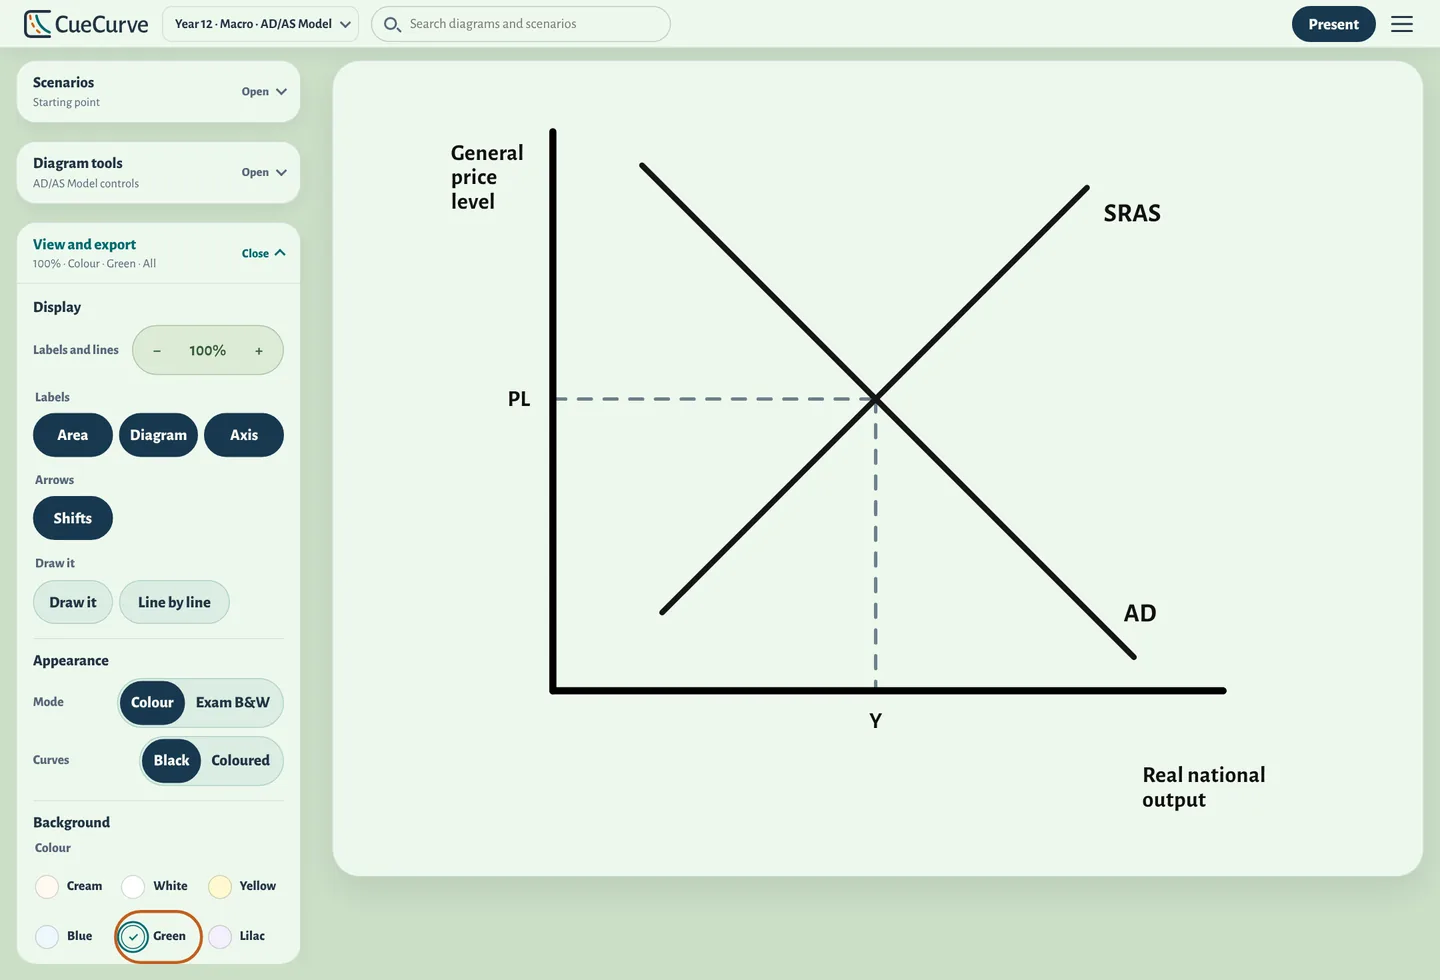
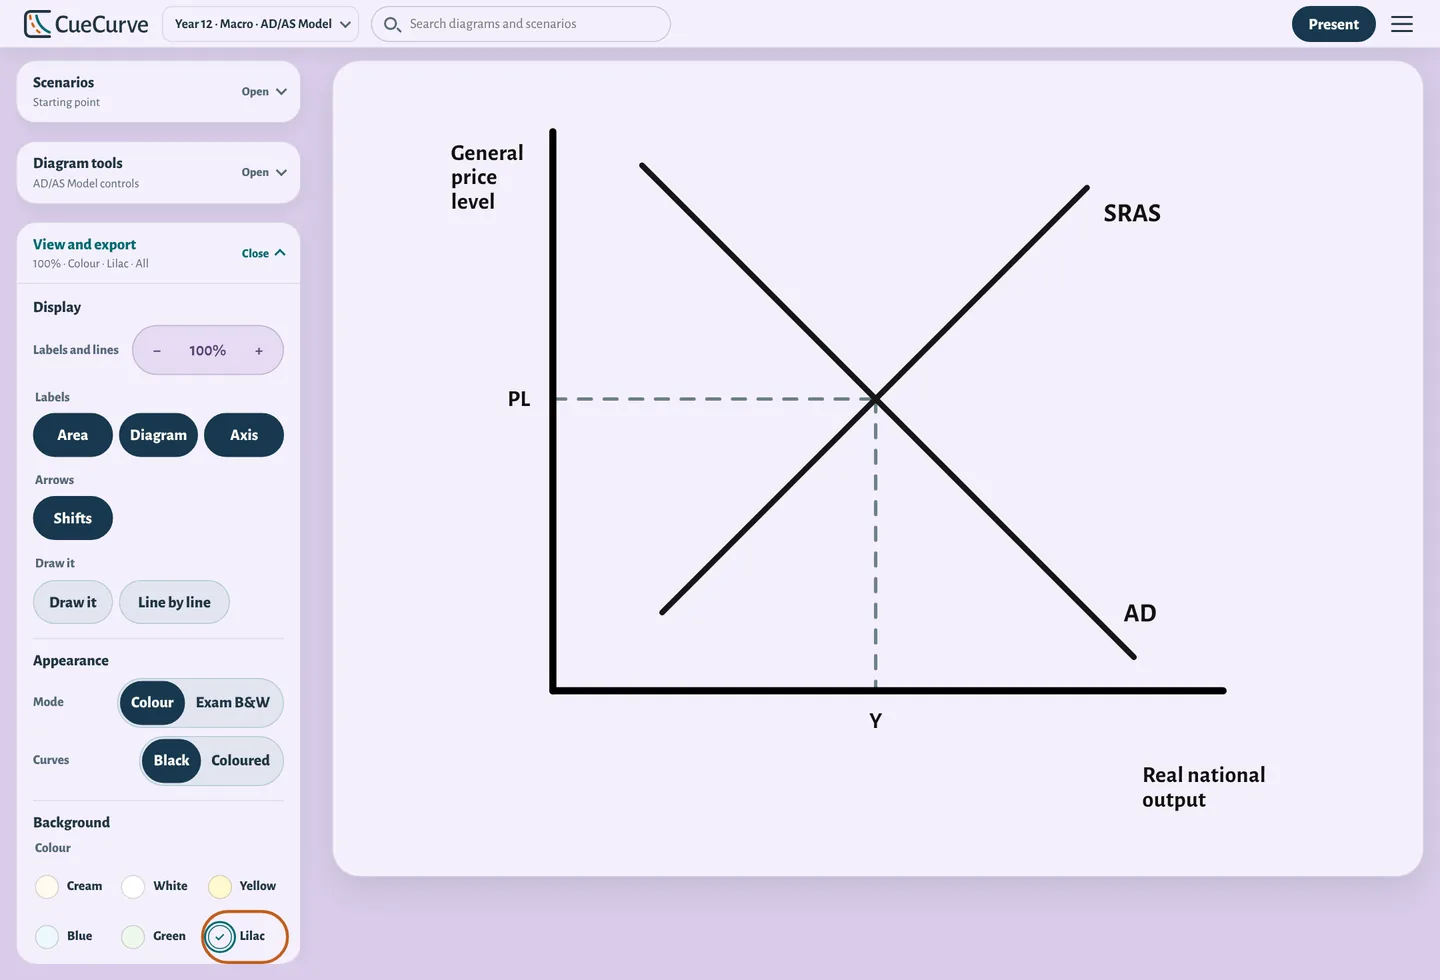
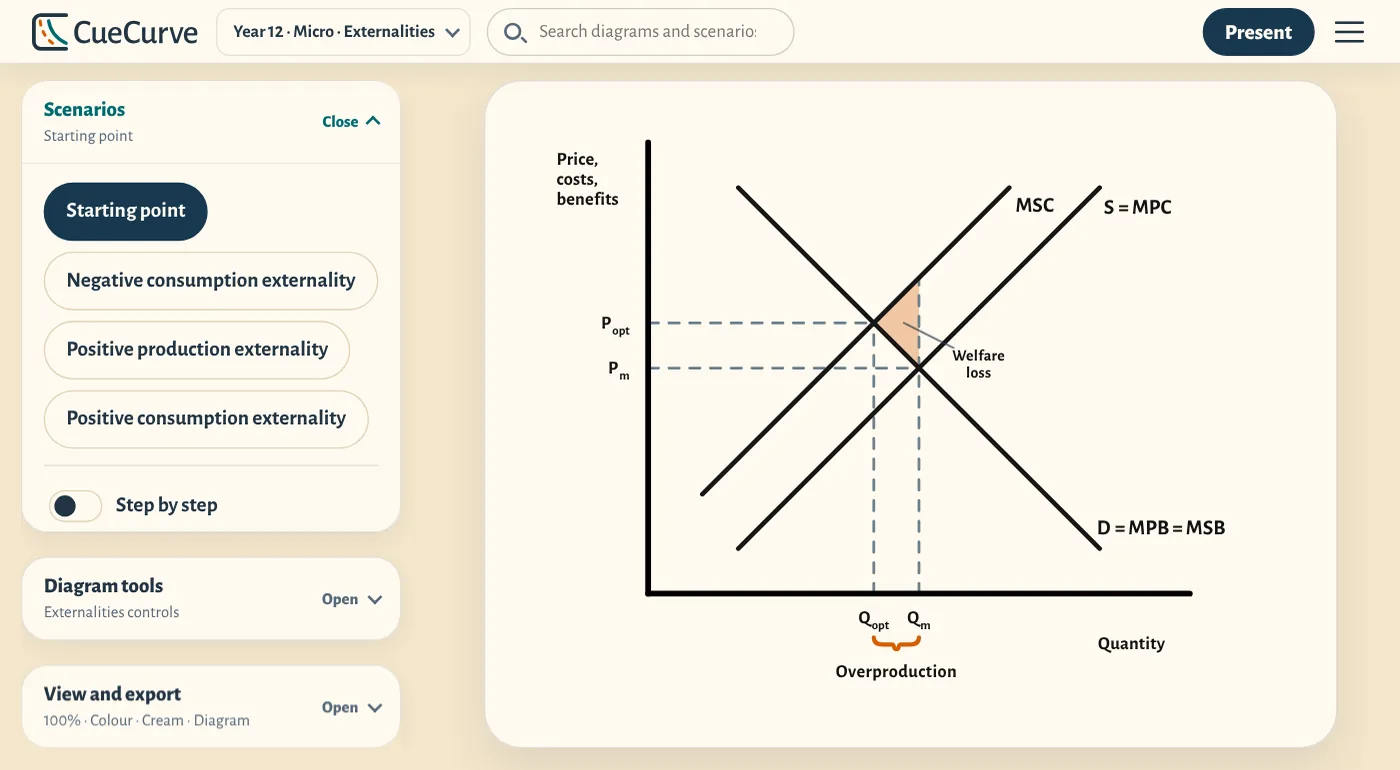
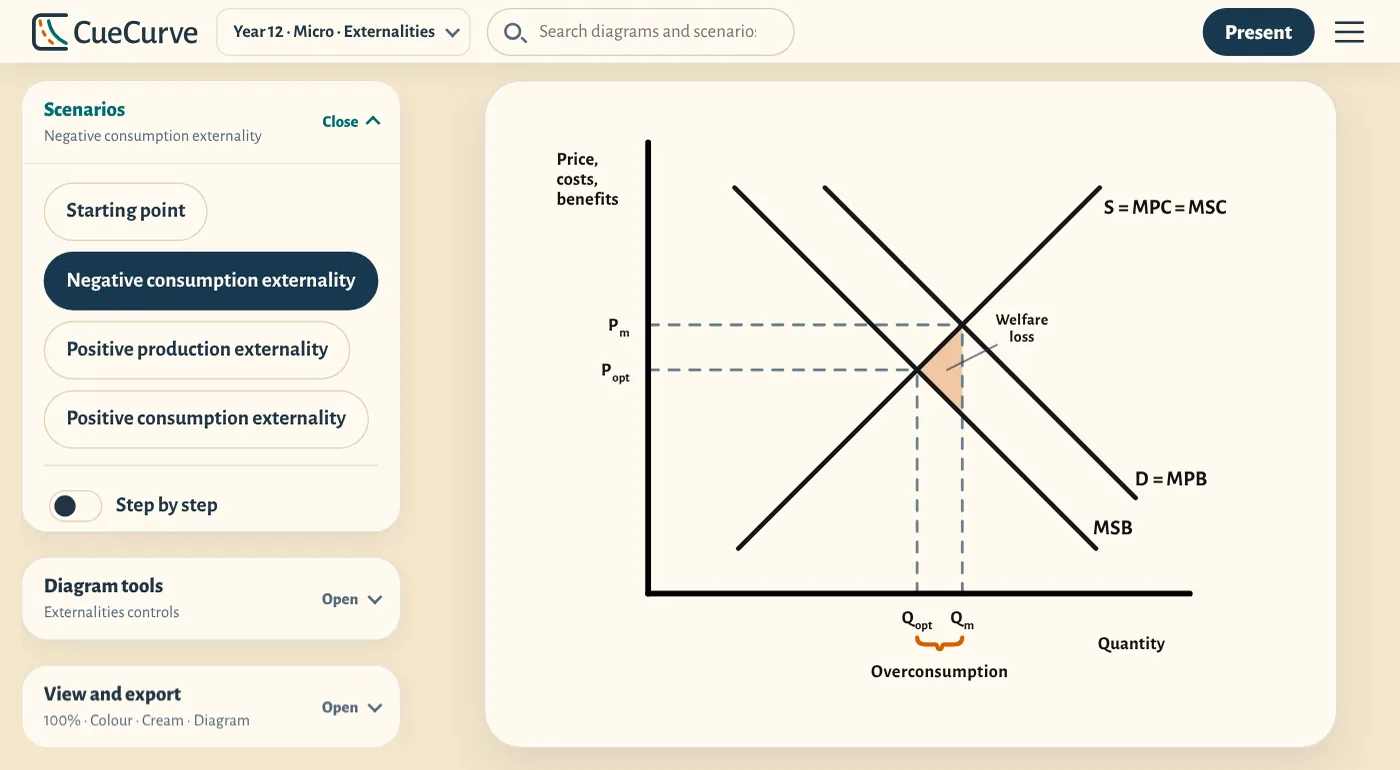
243 ready-made scenarios
Each diagram comes with the versions the exam asks for, such as a negative externality, a subsidy or a decrease in supply. Choose one and CueCurve shows it, or turn on Step by step to reveal it in stages, in the order you'd explain it. Search finds any of them by name.
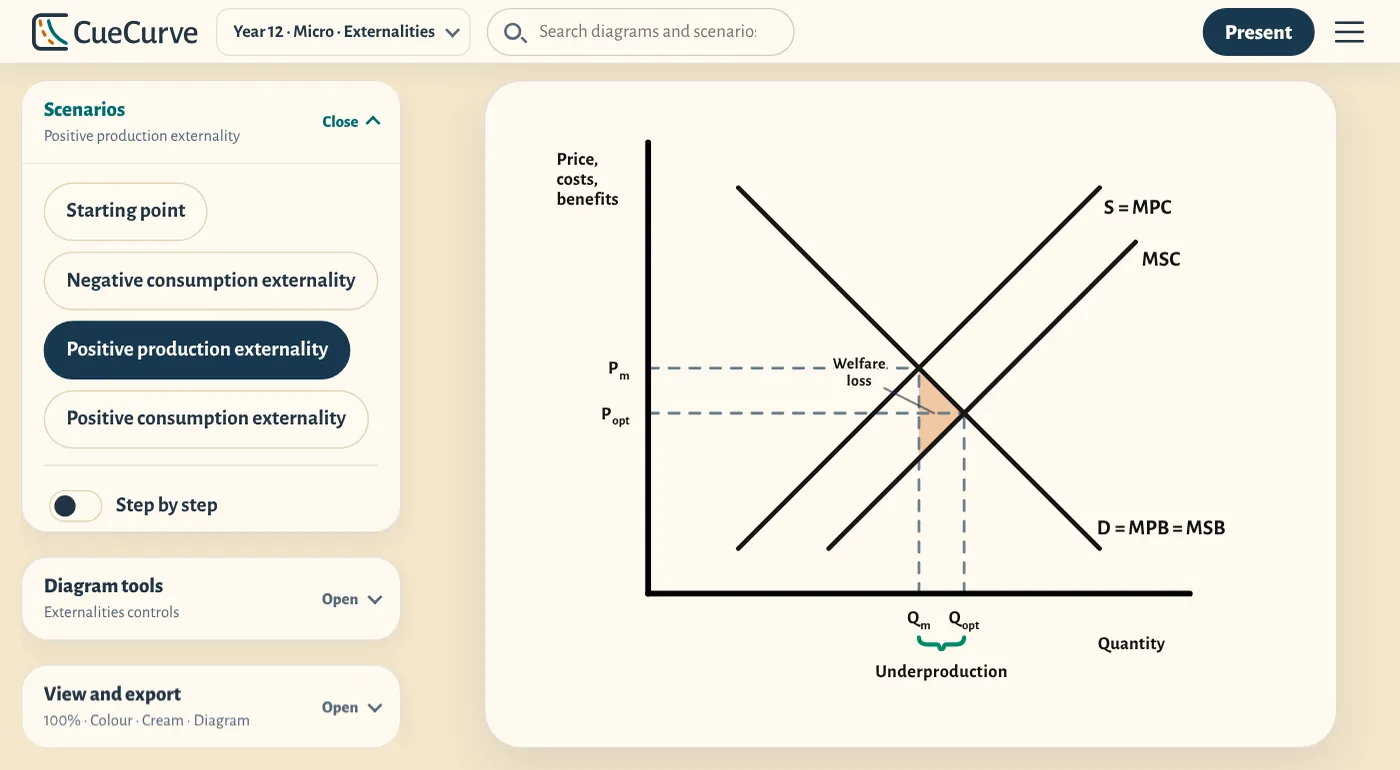
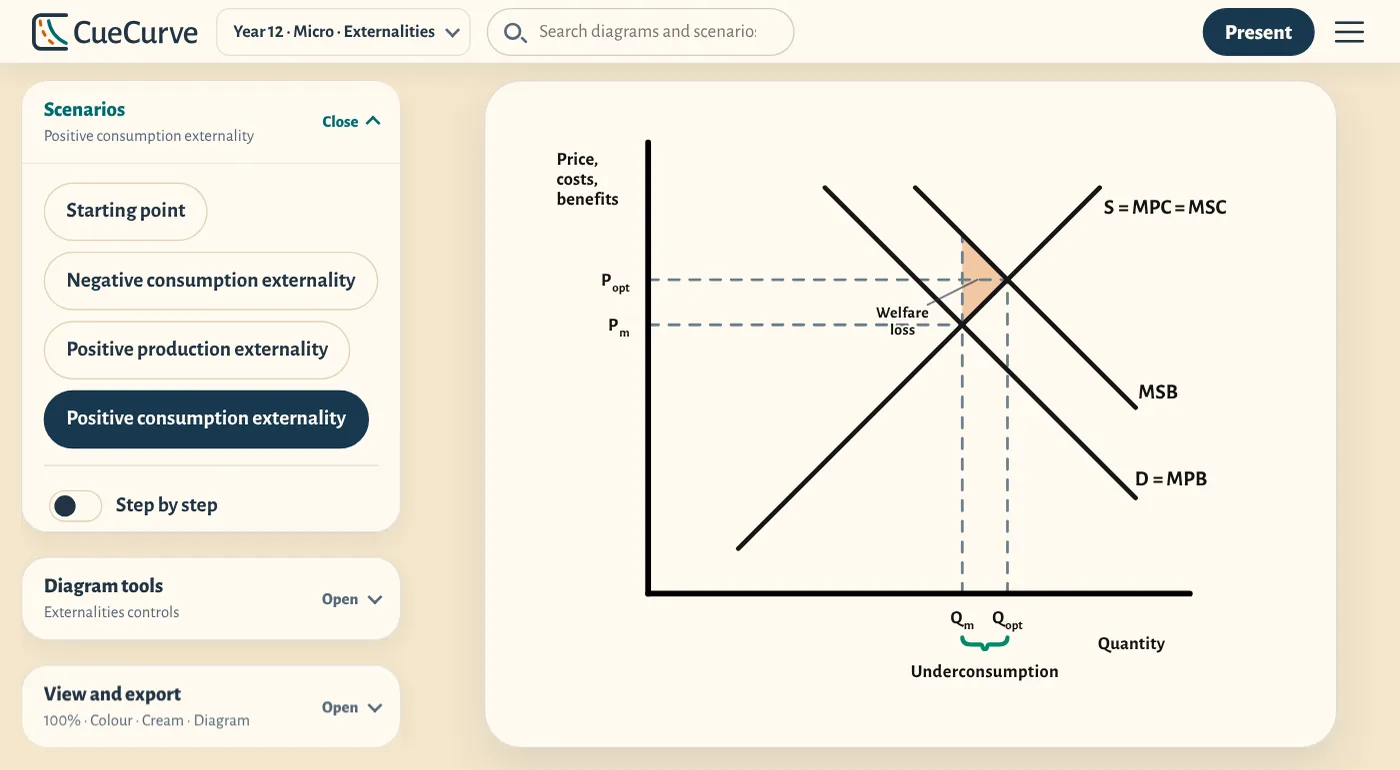
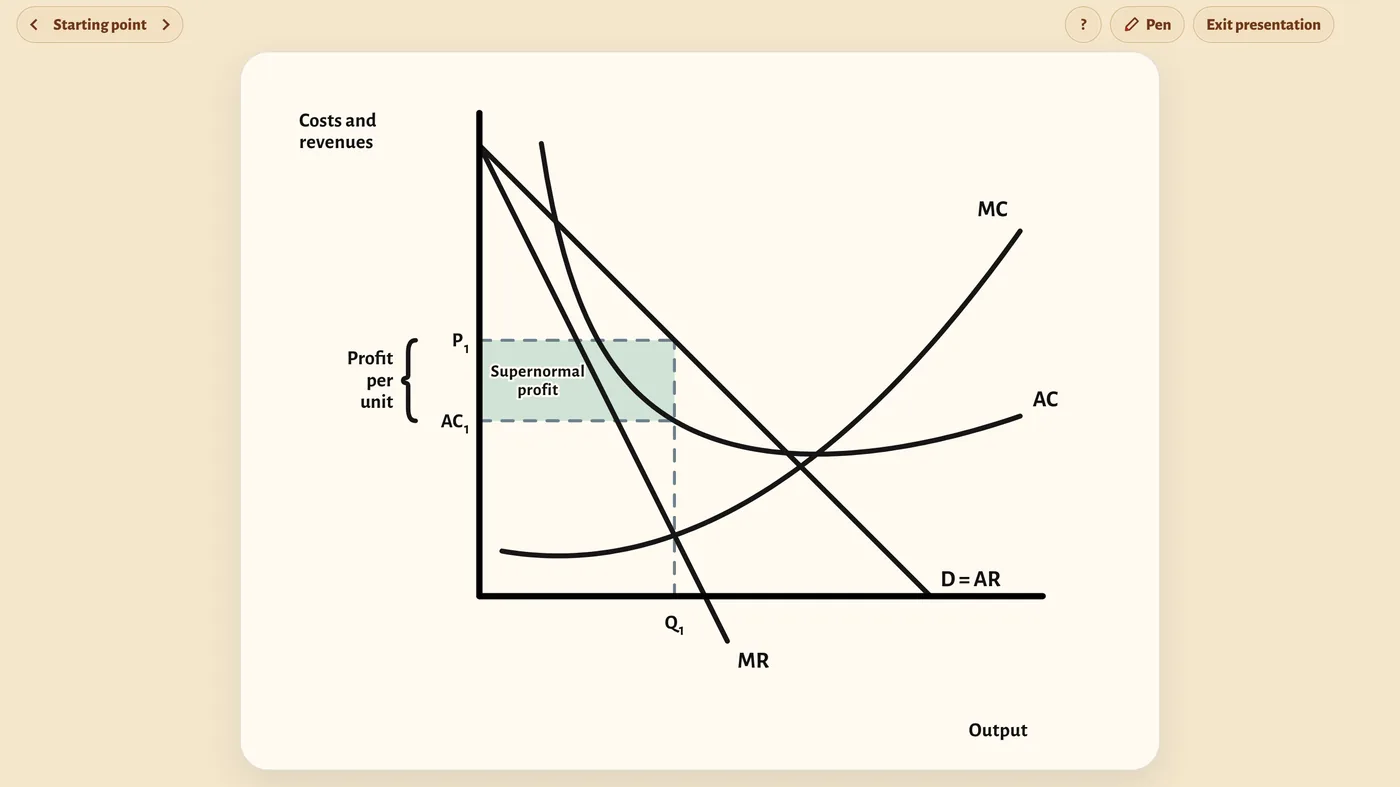
Present it full screen
One click fills the board. Move on with a clicker, draw on it with CueCurve's pen tool, or blank the screen while the class thinks.
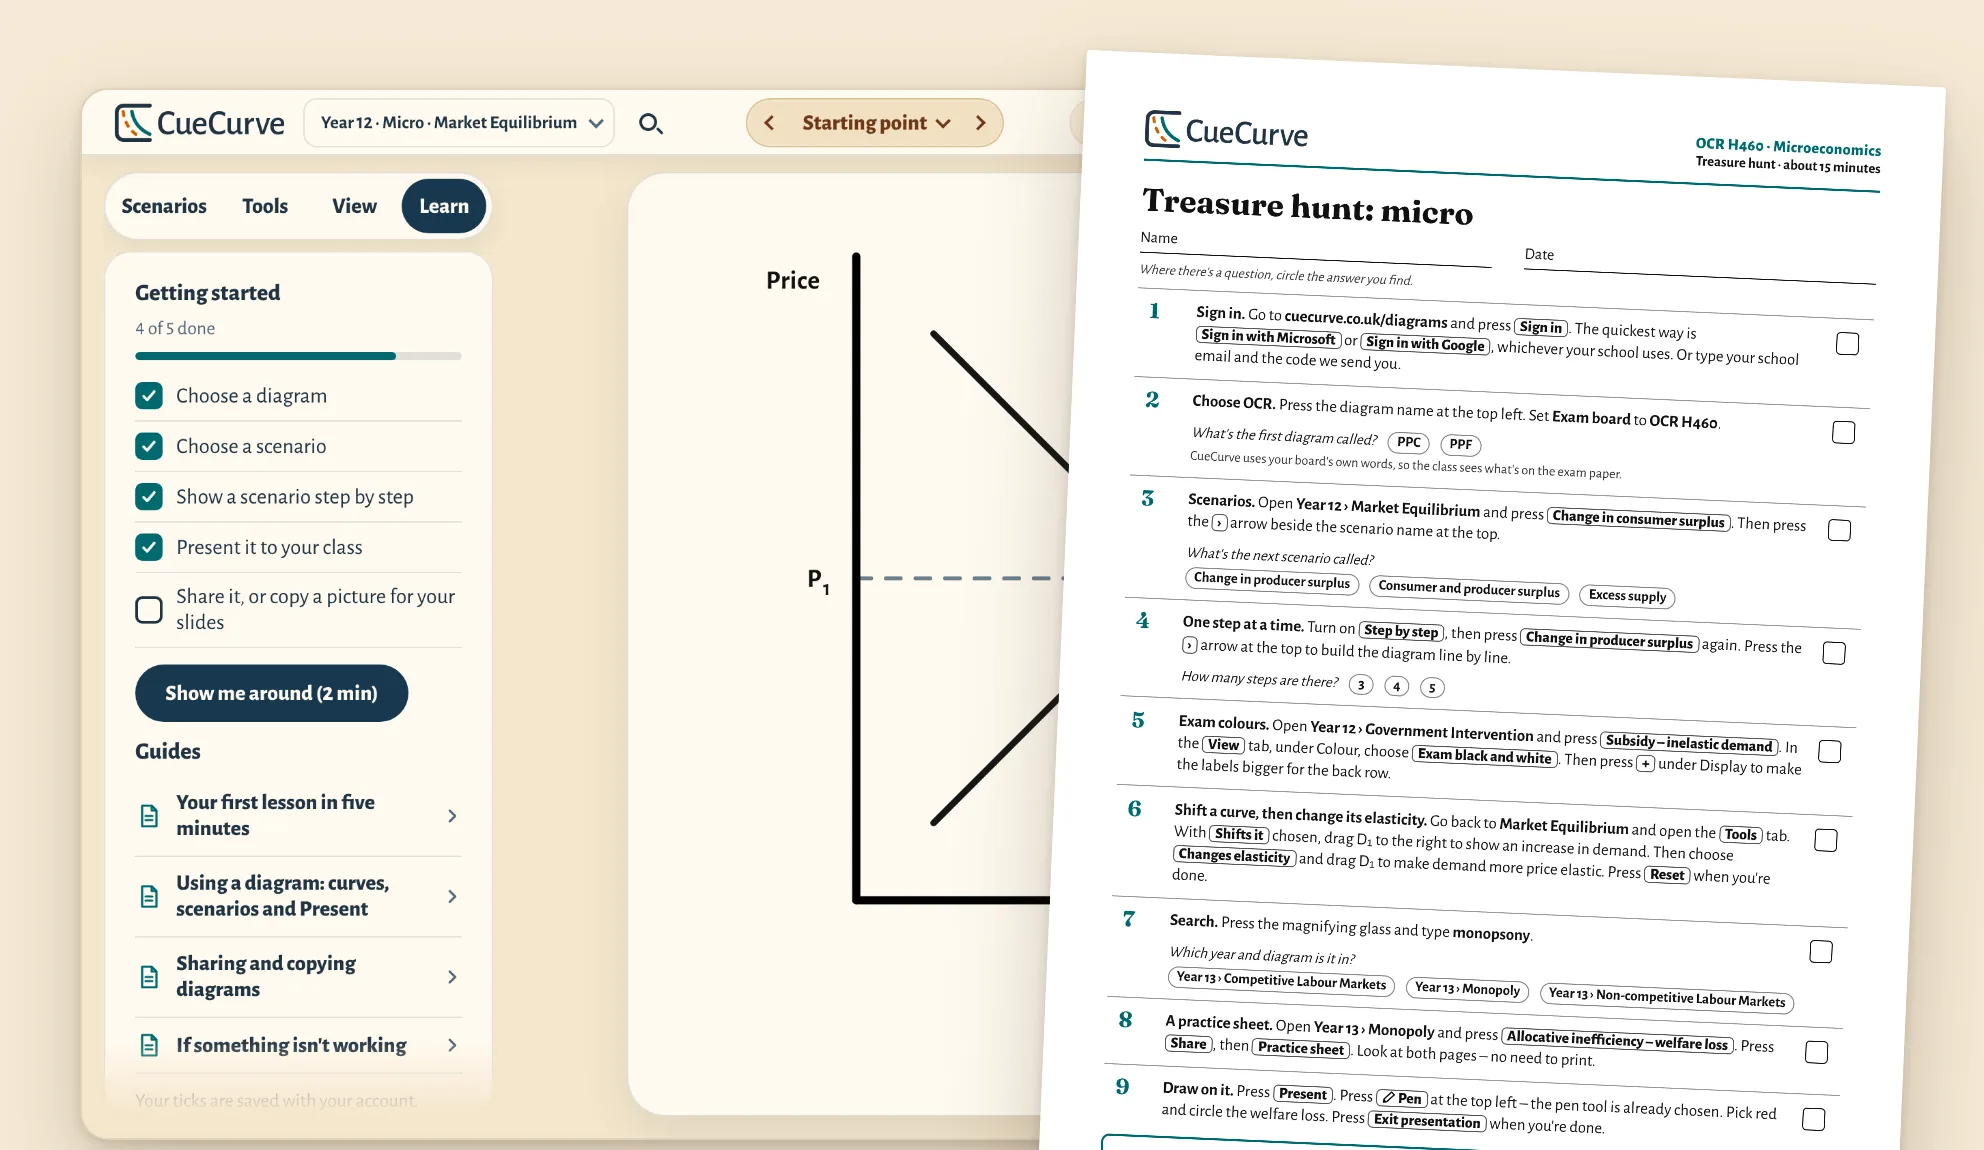
Get your whole department started
Your subscription includes department training to get everyone started with CueCurve, made for your exam board. Learn, CueCurve's interactive guide, shows each teacher what teaching economics interactively can do for their classes, backed up by printed tasks for a short team meeting.
Watch it draw, the way you would at the board
Draw it builds a diagram line by line, in the order you'd draw it for the class. Here, AD rises as the economy nears full capacity, so real GDP and the price level both rise.
33 diagrams, matched to your exam board
Choose your board and CueCurve shows its diagrams in your specification's order, in your exam board's own words.
Free to use now, no sign-up Optional enrichment: beyond the specification, still included
All 33 diagrams, for Year 12 and Year 13
Year 12 micro
Year 12 macro
Year 13 micro
Year 13 macro
Year 12
Theme 1: Introduction to markets and market failure
Theme 2: The UK economy – performance and policies
Year 13
Theme 3: Business behaviour and the labour market
Theme 4: A global perspective
Also in CueCurve, beyond this specification
Year 12
The operation of markets and market failure
The national economy in a global context
Year 13
Individuals, firms, markets and market failure
The national and international economy
Also in CueCurve, beyond this specification
Year 12
Year 13
Microeconomics
Macroeconomics
Year 12
Theme 1: Markets, consumers and firms
Theme 2: The wider economic environment
Year 13
Theme 3: The global economy
Theme 4: Making markets work
Also in CueCurve, beyond this specification
Year 12
Microeconomics (AS content)
Macroeconomics (AS content)
Also in CueCurve, beyond this specification
Year 12
AS: Microeconomics
AS: Macroeconomics
Year 13
Also in CueCurve, beyond this specification
Year 12
1 Basic economic ideas and resource allocation
2 The price system and the microeconomy
3 Government microeconomic intervention
4 The macroeconomy
5 Government macroeconomic intervention
6 International economic issues
Year 13
7 The price system and the microeconomy
8 Government microeconomic intervention
9 The macroeconomy
10 Government macroeconomic intervention
11 International economic issues
Also in CueCurve, beyond this specification
Year 12
Unit 1: Markets in action
Unit 2: Macroeconomic performance and policy
Year 13
Unit 3: Business behaviour
Unit 4: Developments in the global economy
Also in CueCurve, beyond this specification
One simple licence for your school or college
Head of department? Everything your school leaders and finance office need is in one place.
School licence
£99 a year for your department
- Every diagram, for your whole department
- Each teacher signs in with their own email address – a school one where they have it – on any device
- Pay by card, or by invoice to your finance office, with a purchase order number if you need one
- No automatic renewal: you choose each year
- A 30-day refund promise on your first paid year: if CueCurve isn't right for your school, we'll refund you in full
No VAT to add: £99 is the full price.

Founded by an economics teacher
I've taught economics and maths in UK state schools for 20 years, and spent hours making diagrams in PowerPoint so they looked right and matched the exam. I built CueCurve so that time goes on teaching instead.
- Tested in economics classrooms
- No adverts or tracking cookies
- A UK company, with your school's information kept private, in a database in the UK
Try it free in your next lesson
Four diagrams free to use. No sign-up. Opens in your browser.