
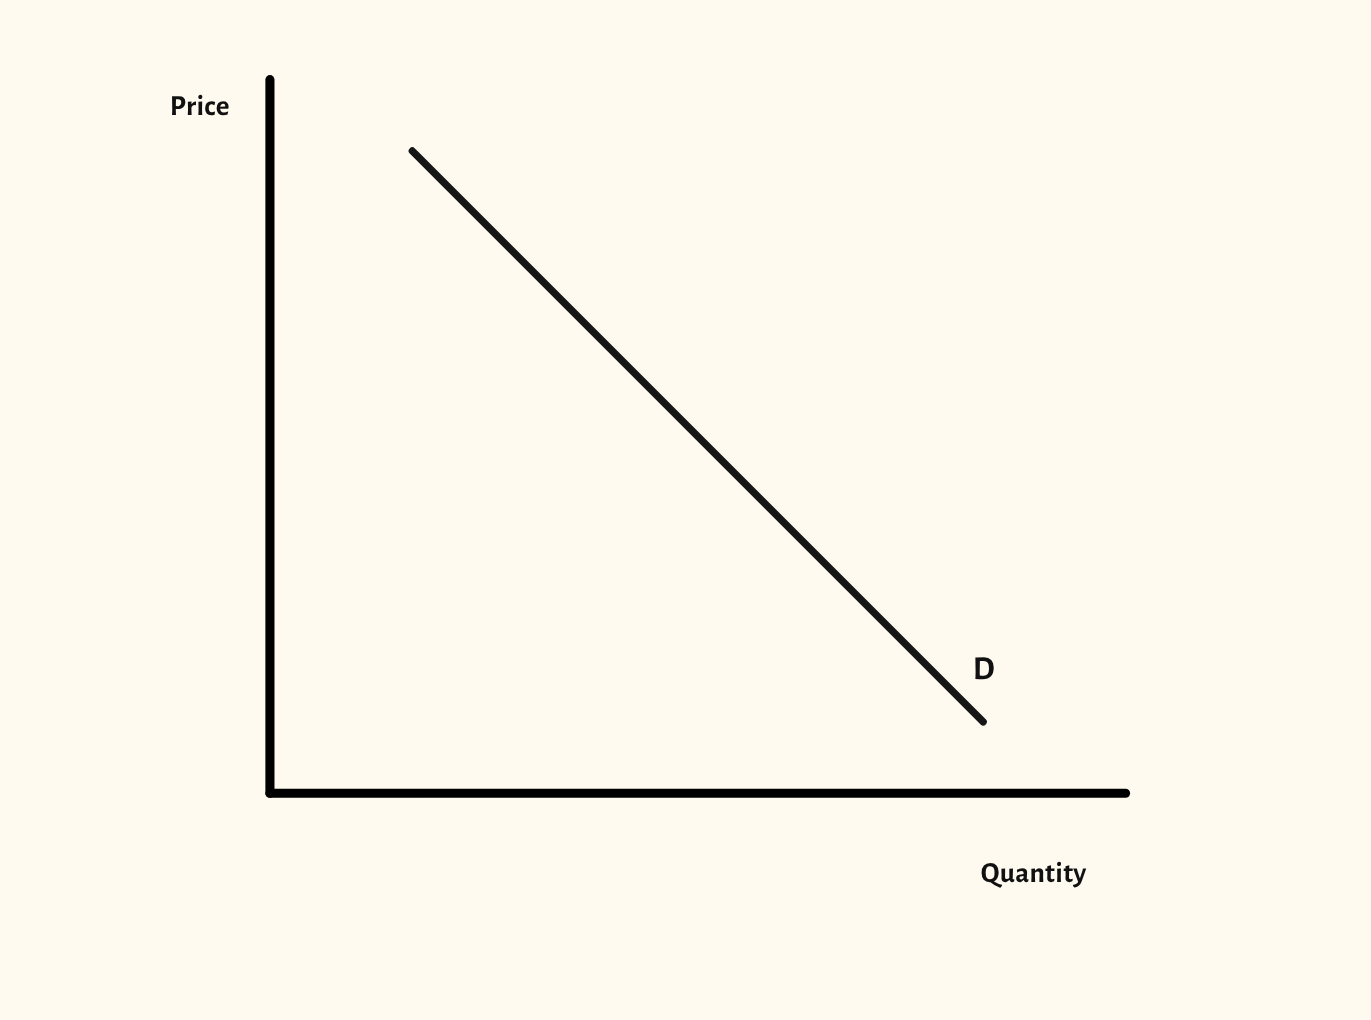
Demand curve diagram
Movements along the demand curve, shifts in demand, related goods and price elasticity of demand, all from one diagram.
Included in the school licence.
Teaching notes
The difference between a movement along the demand curve and a shift of the whole curve is one of the first things an A-level class has to get right, and one of the most common slips in exam answers. This diagram shows both, from a single demand curve.
The scenarios go further: individual and market demand, joint, competitive and composite demand for related goods, and price elasticity of demand with the effect on total revenue.
In a lesson, try naming an event, such as a rise in incomes or a fall in the good's own price, and asking the class whether the curve moves or the point moves along it, before you show the answer. The Supply diagram works the same way, and the two come together in the supply and demand diagram.
What you can show
Each of these is one click in the diagram's Scenarios menu, and each starts from the plain diagram.
- Movement along demand
- Increase in demand
- Decrease in demand
- Individual and market demand
- Joint demand
- Competitive demand
- Composite demand
- Price elasticity of demand and total revenue
- PED and the total revenue curve
- Perfectly elastic demand
- Perfectly inelastic demand
- Unit elastic demand
Exam boards
On the Edexcel A, Edexcel B, AQA, OCR, Eduqas, WJEC, Cambridge International and Edexcel International A-level specifications, drawn in exam style: black lines, clear labels and no grid.