
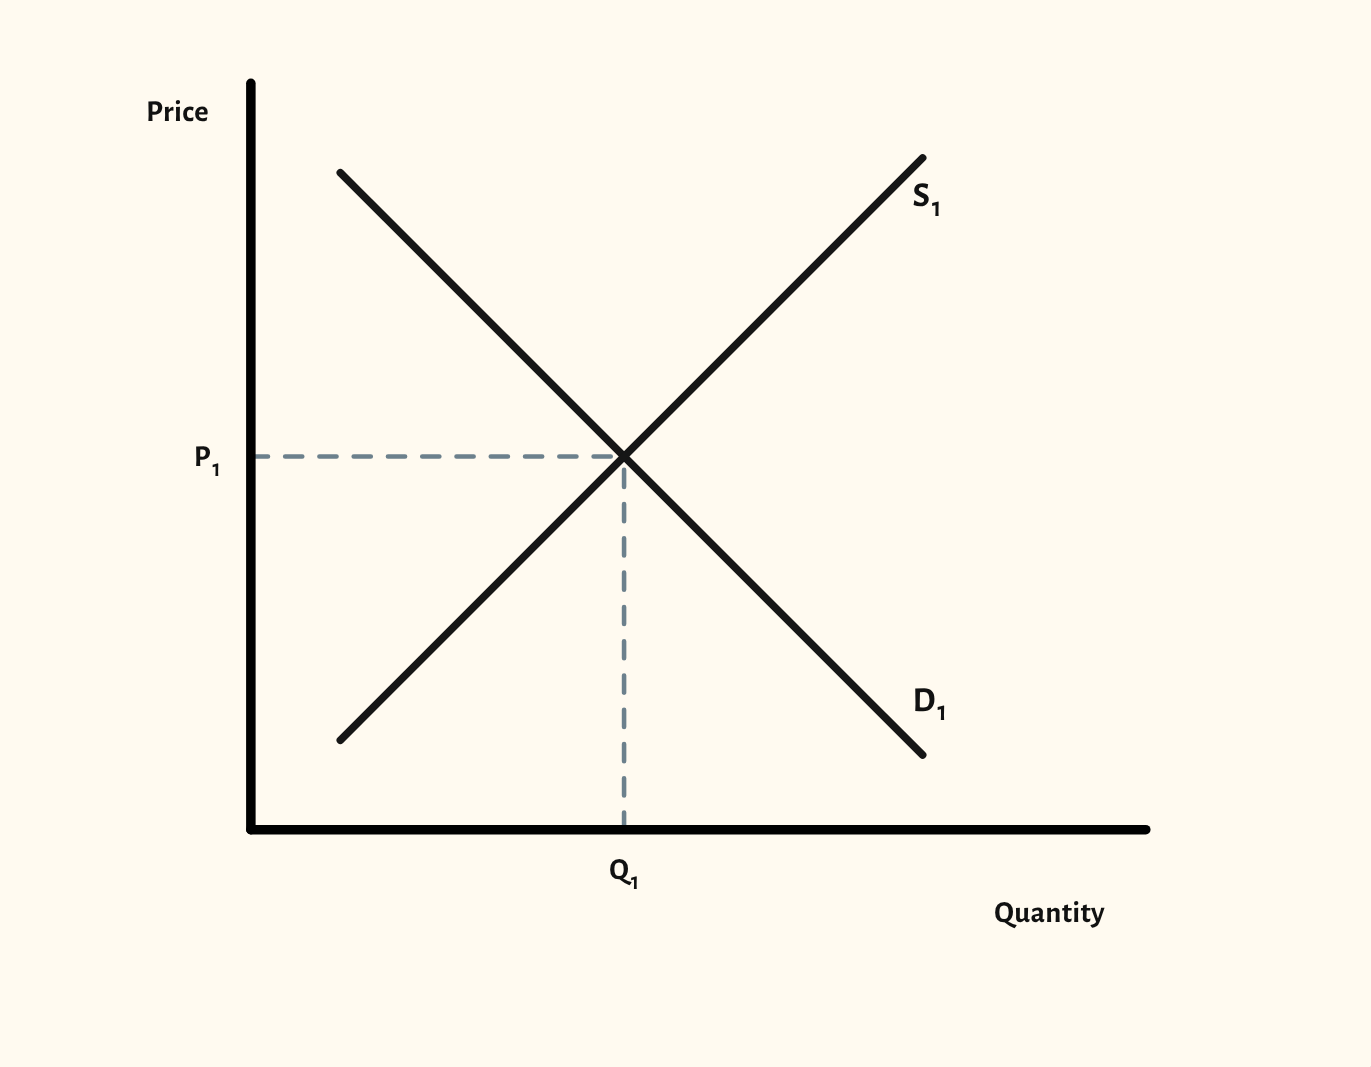
Supply and demand diagram
Shift demand or supply and the new equilibrium price and quantity follow, drawn the way an exam answer should look.
Free, with no account needed.
Teaching notes
This is the diagram almost every A-level Economics course starts with, and the one exam questions come back to again and again. Drag the demand or supply curve itself to shift it, and the diagram labels the new curve D2 or S2 and marks the new equilibrium price and quantity on the axes.
Arrows showing the direction of each shift are on by default in the scenarios, as examiners like to see, and can be turned off in View and export. You can also show the shortage or surplus at a price away from equilibrium, and shade consumer and producer surplus.
In a lesson, try drawing the starting position, asking the class which curve moves for a given event, then dragging it to check. Present mode shows the diagram full screen, large enough for the back of the room, and you can hide the labels so the class has to supply them.
What you can show
Each of these is one click in the diagram's Scenarios menu, and each starts from the plain diagram.
- Increase in demand
- Decrease in demand
- Increase in supply
- Decrease in supply
- Increase in demand and supply
- Excess demand
- Excess supply
- Consumer and producer surplus
- Change in consumer surplus
- Change in producer surplus
Exam boards
On the Edexcel A, Edexcel B, AQA, OCR, Eduqas, WJEC, Cambridge International and Edexcel International A-level specifications, drawn in exam style: black lines, clear labels and no grid.