
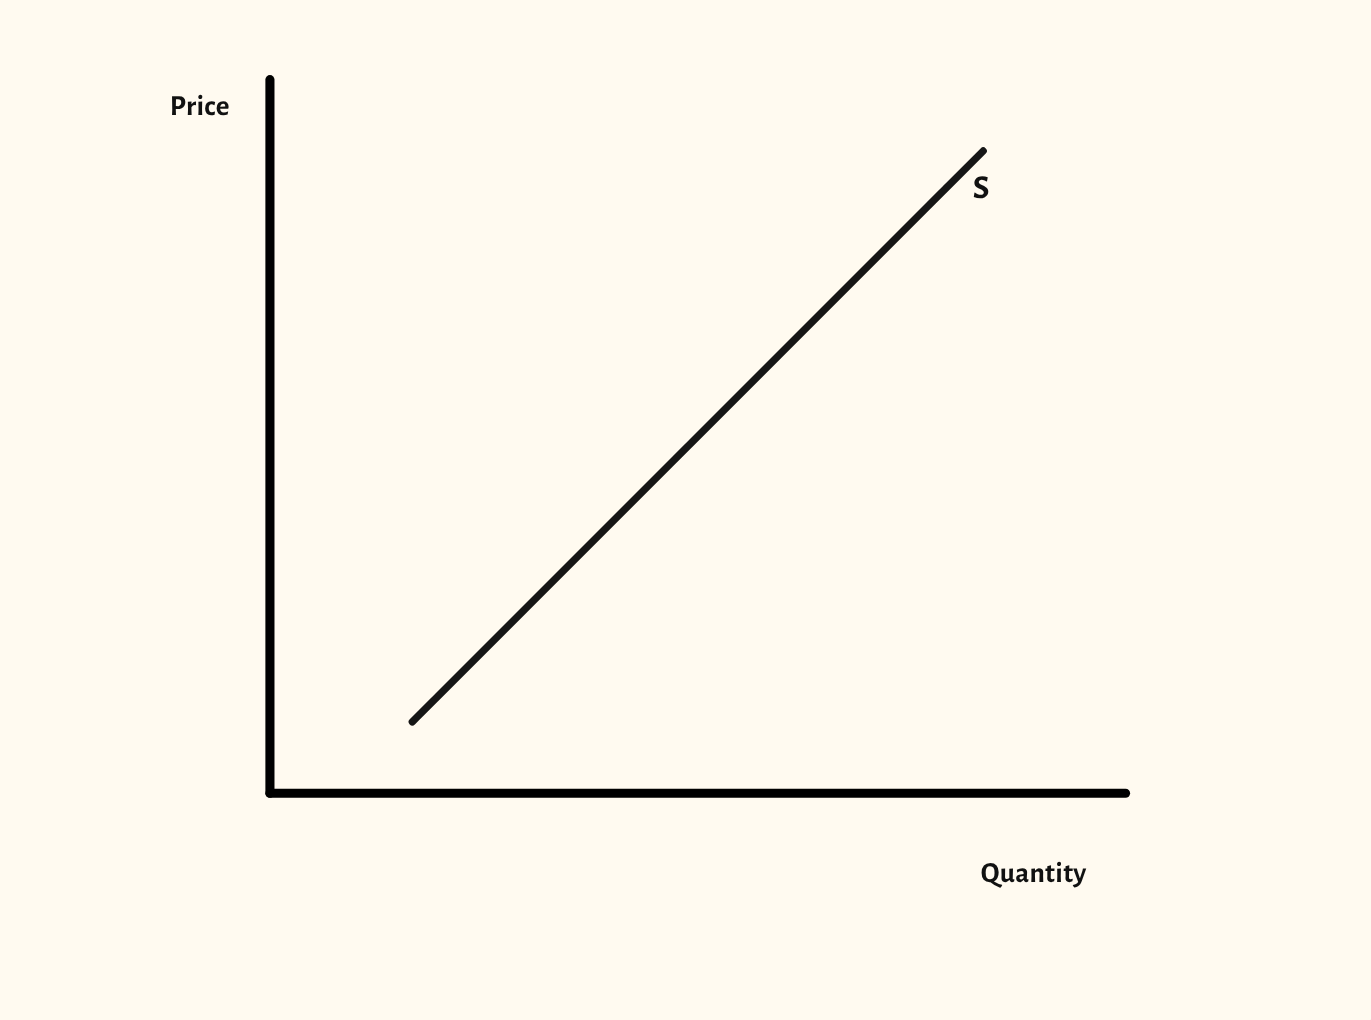
Supply curve diagram
Movements along the supply curve, shifts in supply, related goods and price elasticity of supply, all from one diagram.
Included in the school licence.
Teaching notes
Supply mirrors demand: a change in the good's own price is a movement along the curve, and a change in anything else, such as costs of production, shifts it. This diagram shows both from a single supply curve.
The scenarios also cover individual and market supply, joint and competitive supply, and price elasticity of supply, so the related ideas sit in one place rather than on separate drawings.
In a lesson, try listing causes of a shift, such as a new technology, an indirect tax or a rise in wages, and asking the class which way each moves the curve before you show it. It pairs with the Demand diagram before the two are brought together in the supply and demand diagram.
What you can show
Each of these is one click in the diagram's Scenarios menu, and each starts from the plain diagram.
- Movement along supply
- Increase in supply
- Decrease in supply
- Individual and market supply
- Joint supply
- Competitive supply
- Price elasticity of supply
- Perfectly elastic supply
- Perfectly inelastic supply
- Unit elastic supply
Exam boards
On the Edexcel A, Edexcel B, AQA, OCR, Eduqas, WJEC, Cambridge International and Edexcel International A-level specifications, drawn in exam style: black lines, clear labels and no grid.