
Monopoly diagram
Profit maximisation where MC = MR, with supernormal profit shaded, then welfare loss, price discrimination and natural monopoly in one click each.
Included in the school licence.
Teaching notes
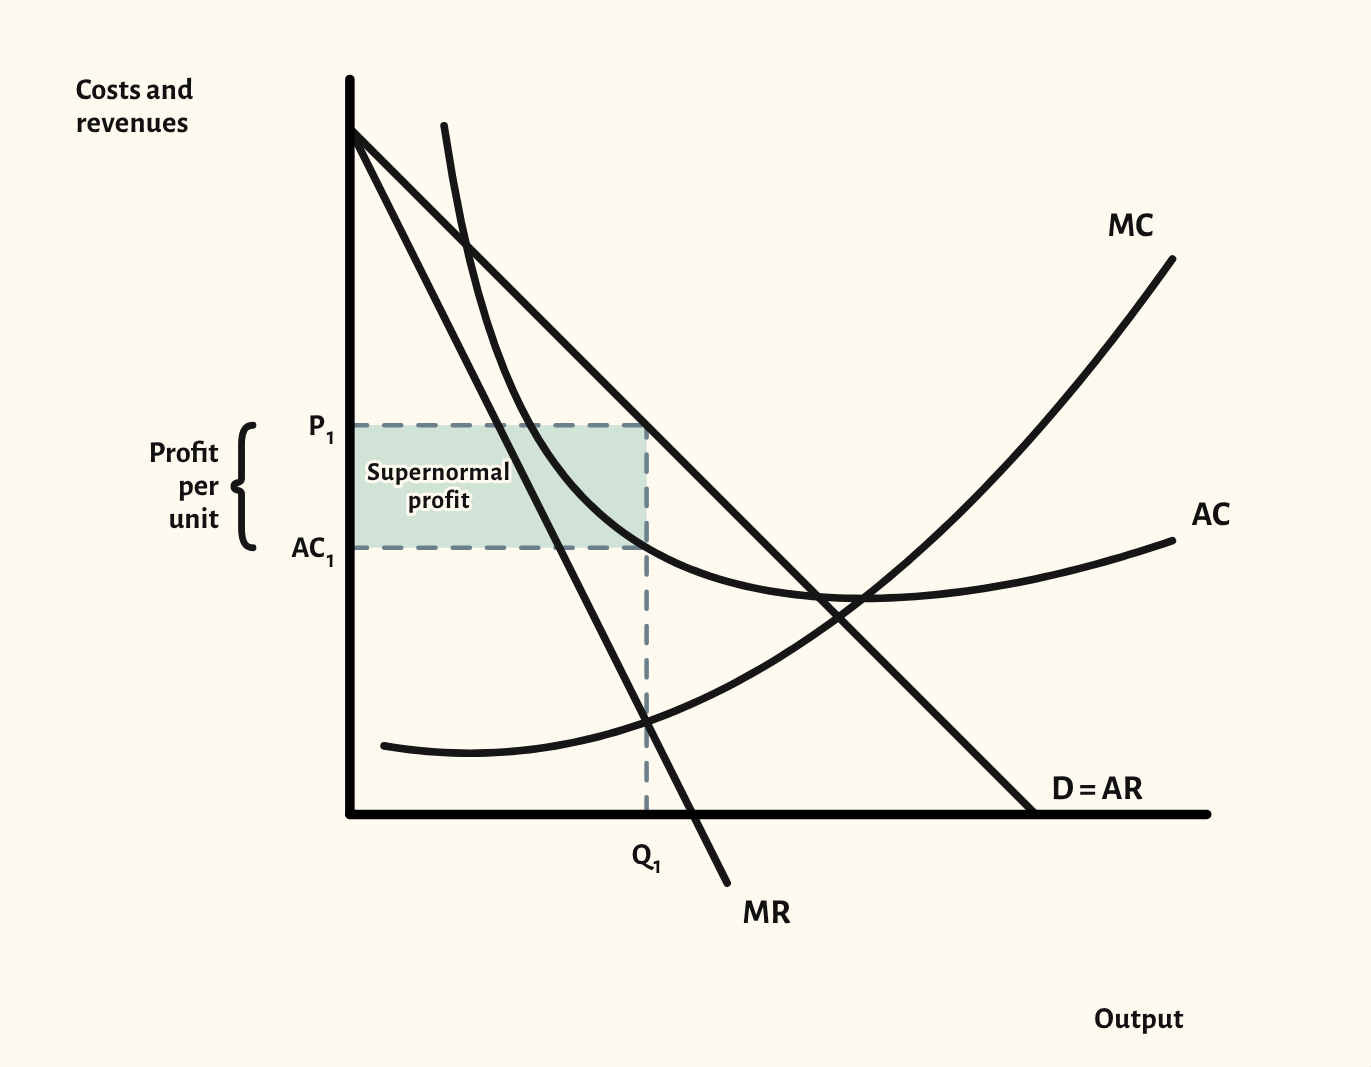
The monopoly diagram has more curves than almost any other at A-level, and every one has to be in the right place: MR twice as steep as AR, MC cutting AC at its lowest point, and output read off where MC = MR. CueCurve keeps those rules for you, so the diagram is always drawn correctly, however the curves are moved.
The starting point shows a profit-maximising monopolist making supernormal profit, with price and average cost marked and the profit per unit bracketed. From there you can show normal profit and a loss, compare profit maximisation with the allocatively and productively efficient outputs, and shade the welfare loss.
There are also scenarios for third-degree price discrimination, and for natural monopoly, comparing marginal-cost and average-cost pricing, which comes up in questions on regulation.
In a lesson, try hiding the labels and asking the class to name each curve and the profit-maximising output before you reveal them.
What you can show
Each of these is one click in the diagram's Scenarios menu, and each starts from the plain diagram.
- Normal profit
- Loss
- Revenue maximisation
- Sales volume maximisation
- Allocative inefficiency – welfare loss
- Productive inefficiency
- Price cap
- Third-degree price discrimination
- Third-degree price discrimination – whole market
- Natural monopoly – marginal-cost pricing
- Natural monopoly – average-cost pricing
Exam boards
On the Edexcel A, Edexcel B, AQA, OCR, Eduqas, WJEC, Cambridge International and Edexcel International A-level specifications, drawn in exam style: black lines, clear labels and no grid.