
Kinked demand curve and pay-off matrix
The kinked demand curve model of oligopoly, with the gap in marginal revenue that explains why prices stay sticky, and a two-firm pay-off matrix for the prisoner's dilemma.
Free, with no account needed.
Teaching notes
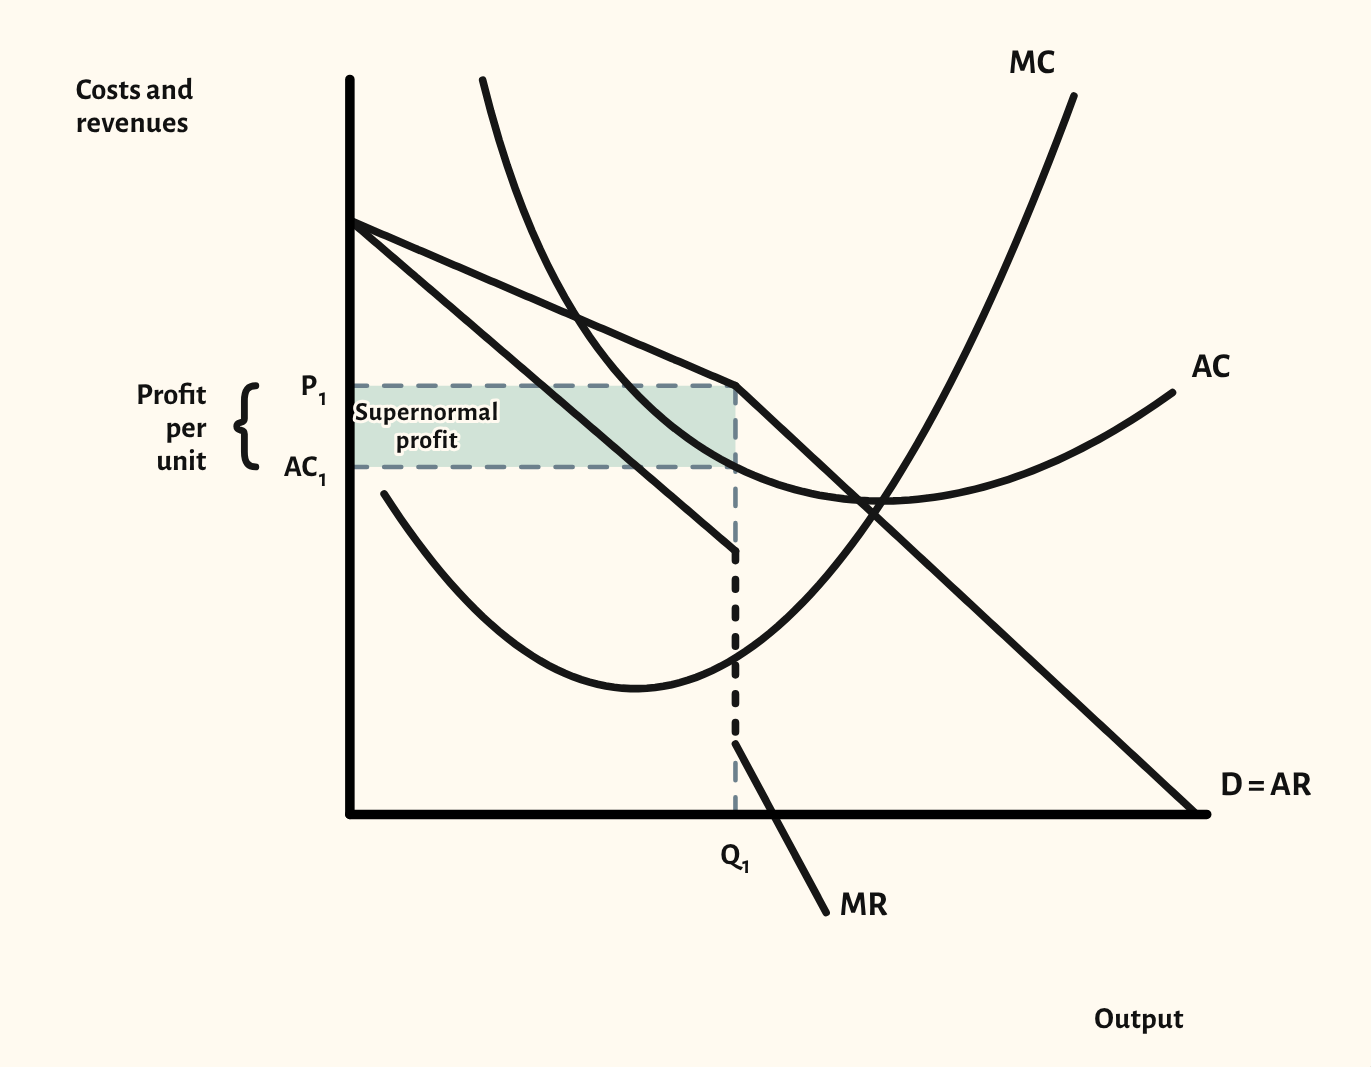
The kinked demand curve explains why prices in an oligopoly tend to stay put. Above the current price, rivals don't follow a price rise, so demand is elastic; below it, they match a price cut, so demand is inelastic. The result is a kink in demand and a vertical gap in marginal revenue.
The scenarios move marginal cost to show the key point: if MC rises but stays within the gap, the profit-maximising price and output don't change. If it rises above the gap or falls below it, they do. That makes the model's prediction, and its limits, easy to see.
The pay-off matrix shows two firms each choosing a high or a low price, as a prisoner's dilemma. Mark Firm A's best replies, then Firm B's, to find each firm's dominant strategy and the Nash equilibrium, then show the collusive outcome both firms would prefer. You can change any pay-off to match the numbers in an exam question, and the marks update as you go.
In a lesson, try starting with the plain diagram and asking the class what would happen to price if a firm's costs rose a little. Then step through the three kinked-demand scenarios. Remember to discuss the model's weaknesses too, such as not explaining how the price was set in the first place.
What you can show
Each of these is one click in the diagram's Scenarios menu, and each starts from the plain diagram.
- Marginal cost rises within the gap
- Marginal cost rises above the gap
- Marginal cost falls below the gap
- Find the Nash equilibrium
- Collusion and Nash compared
- Firm B has no dominant strategy
Exam boards
On the Edexcel A, Edexcel B, AQA, OCR, Eduqas, WJEC, Cambridge International and Edexcel International A-level specifications, drawn in exam style: black lines, clear labels and no grid.