
Monopolistic competition diagram
Short-run supernormal profit or loss, long-run normal profit where AR touches AC, and the inefficiencies that remain.
Included in the school licence.
Teaching notes
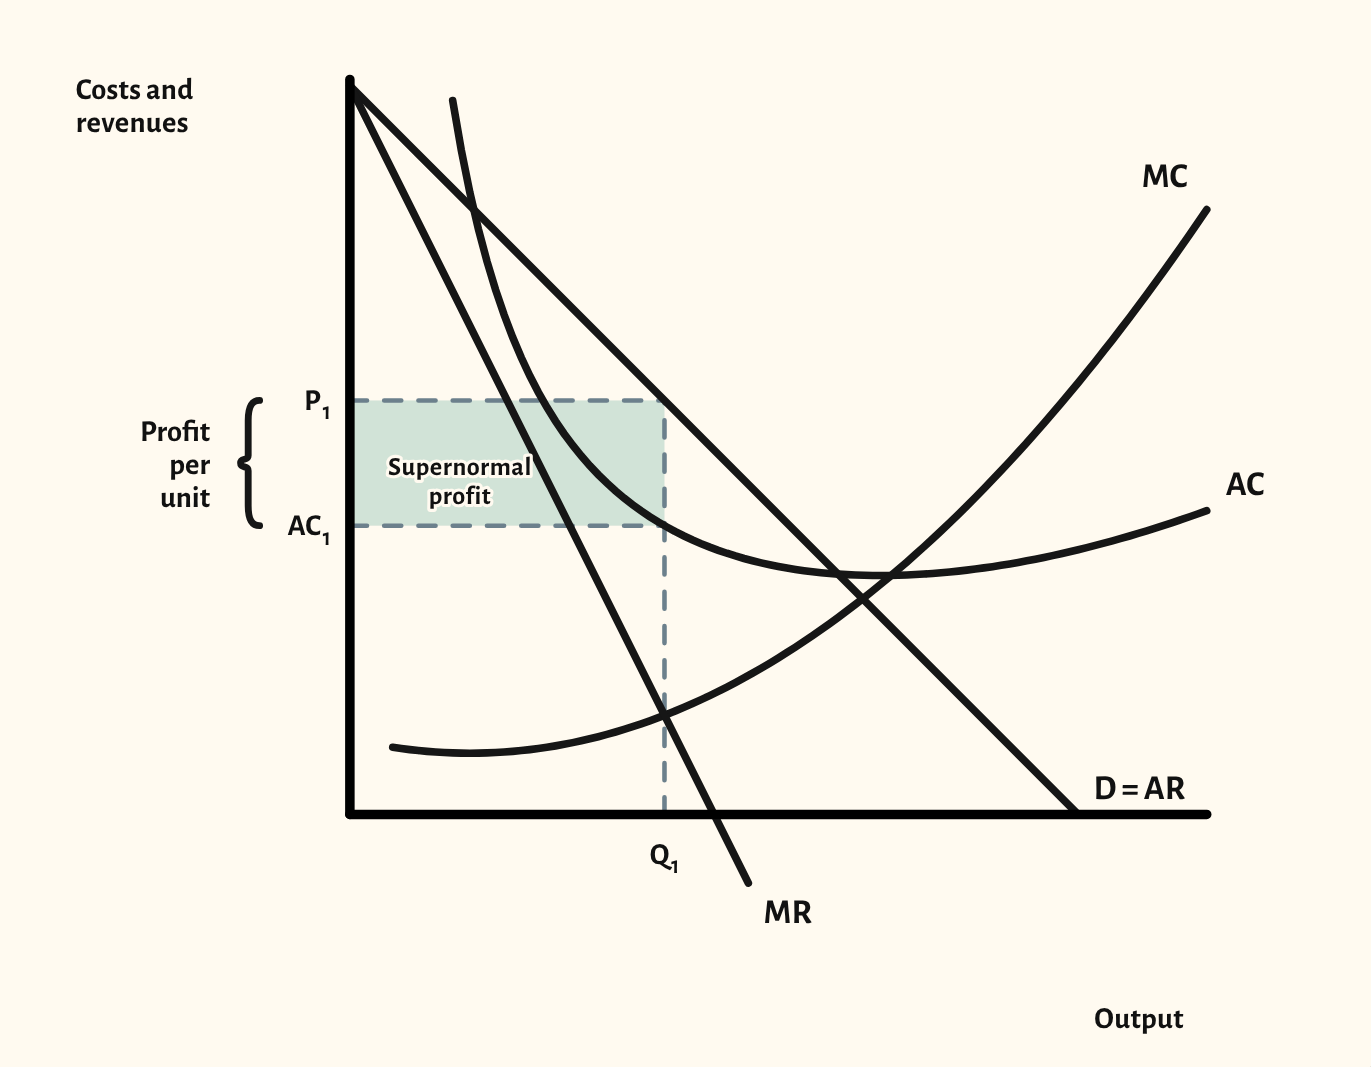
Monopolistic competition looks like monopoly in the short run and like perfect competition in the long run, and the diagram has to show both. The starting point shows a firm making supernormal profit, with price, average cost and the profit per unit marked.
The scenarios show a short-run loss, the long-run position where demand has fallen until AR just touches AC and the firm makes normal profit, and the allocative and productive inefficiency that remains.
In a lesson, try asking the class what new firms entering the market would do to one firm's demand curve, then step to the long run to show it. Comparing the long run with perfect competition shows why the industry has excess capacity.
What you can show
Each of these is one click in the diagram's Scenarios menu, and each starts from the plain diagram.
- Short run – loss
- Long run – normal profit
- Allocative and productive inefficiency
Exam boards
On the Edexcel A, AQA, OCR, Eduqas, WJEC, Cambridge International and Edexcel International A-level specifications, drawn in exam style: black lines, clear labels and no grid.