
Perfect competition diagram
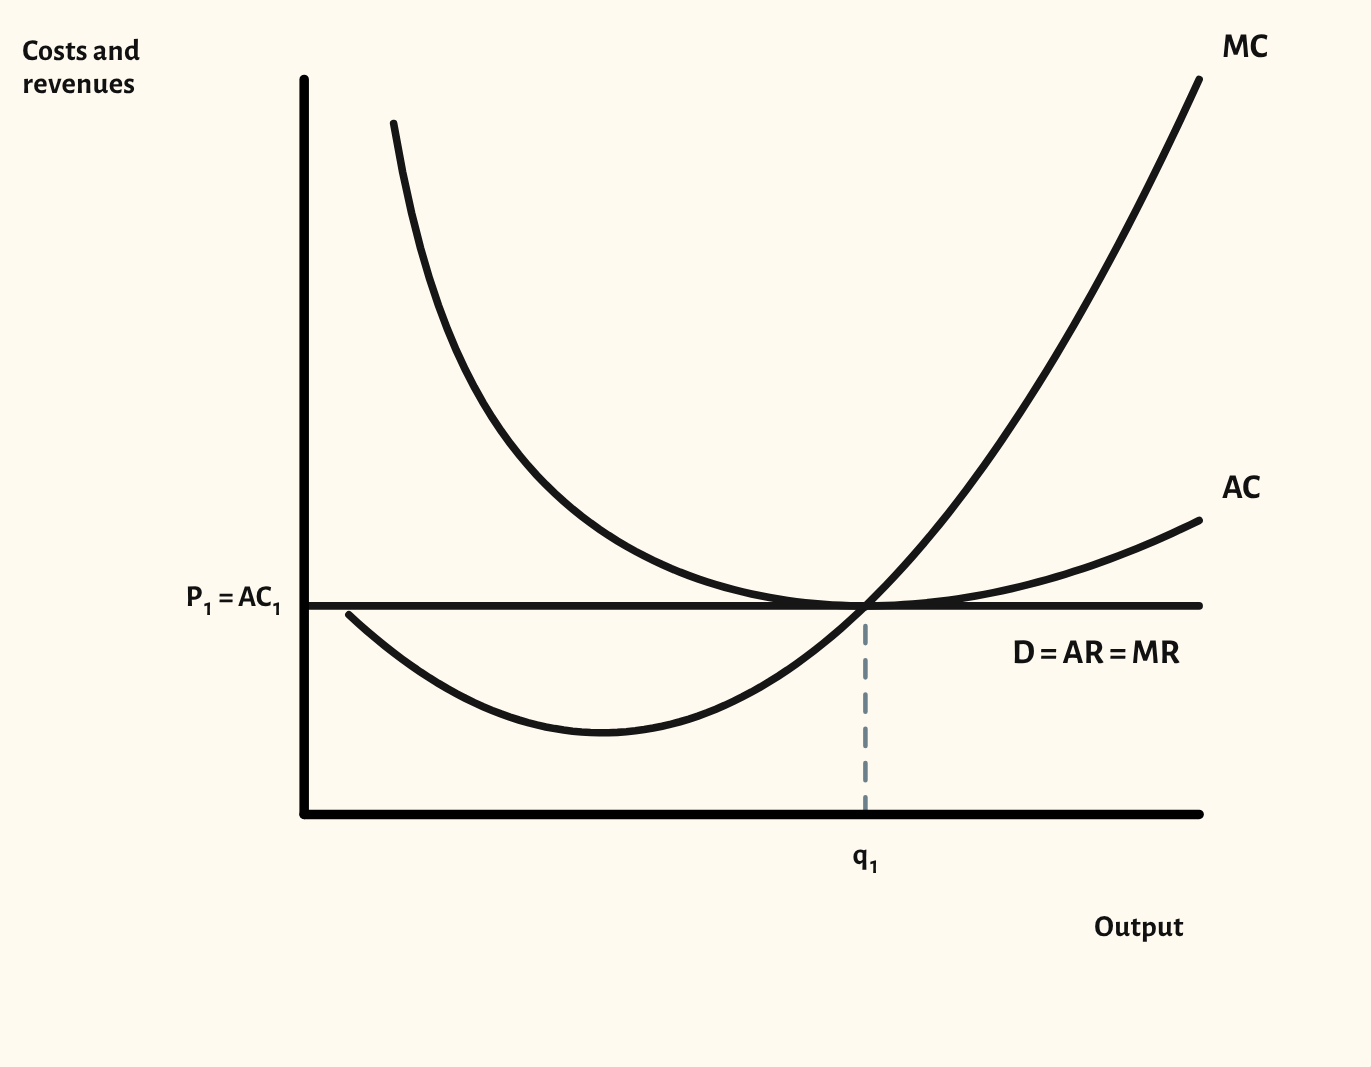
The perfectly competitive firm as a price taker, in long-run equilibrium, with short-run profit and loss and the shutdown point.
Included in the school licence.
Teaching notes
Perfect competition is the benchmark the other market structures are measured against. The starting point shows the firm in long-run equilibrium: a price taker with a horizontal demand curve, making normal profit where price equals the lowest point of average cost.
The scenarios show supernormal profit and a loss in the short run, then the shutdown point and what happens below it. Choose Industry and firm to put the industry's demand and supply beside the firm, so the class can see where the price comes from.
In a lesson, try the Industry and firm scenario and ask the class what would happen to the number of firms. Then drag industry supply to the right to show entry: the price falls until the firm is back at normal profit in the long run. It makes the comparison with monopoly much clearer.
What you can show
Each of these is one click in the diagram's Scenarios menu, and each starts from the plain diagram.
- Short run – supernormal profit
- Short run – loss
- Industry and firm – supernormal profit
- Shutdown point
- Below the shutdown point
Exam boards
On the Edexcel A, Edexcel B, AQA, OCR, Eduqas, WJEC, Cambridge International and Edexcel International A-level specifications, drawn in exam style: black lines, clear labels and no grid.