
Cost, revenue and profit diagrams
Total, average and marginal product, marginal and average cost, revenue curves, profit and loss, and the outputs for profit, sales revenue and sales volume maximisation.
Included in the school licence.
Teaching notes
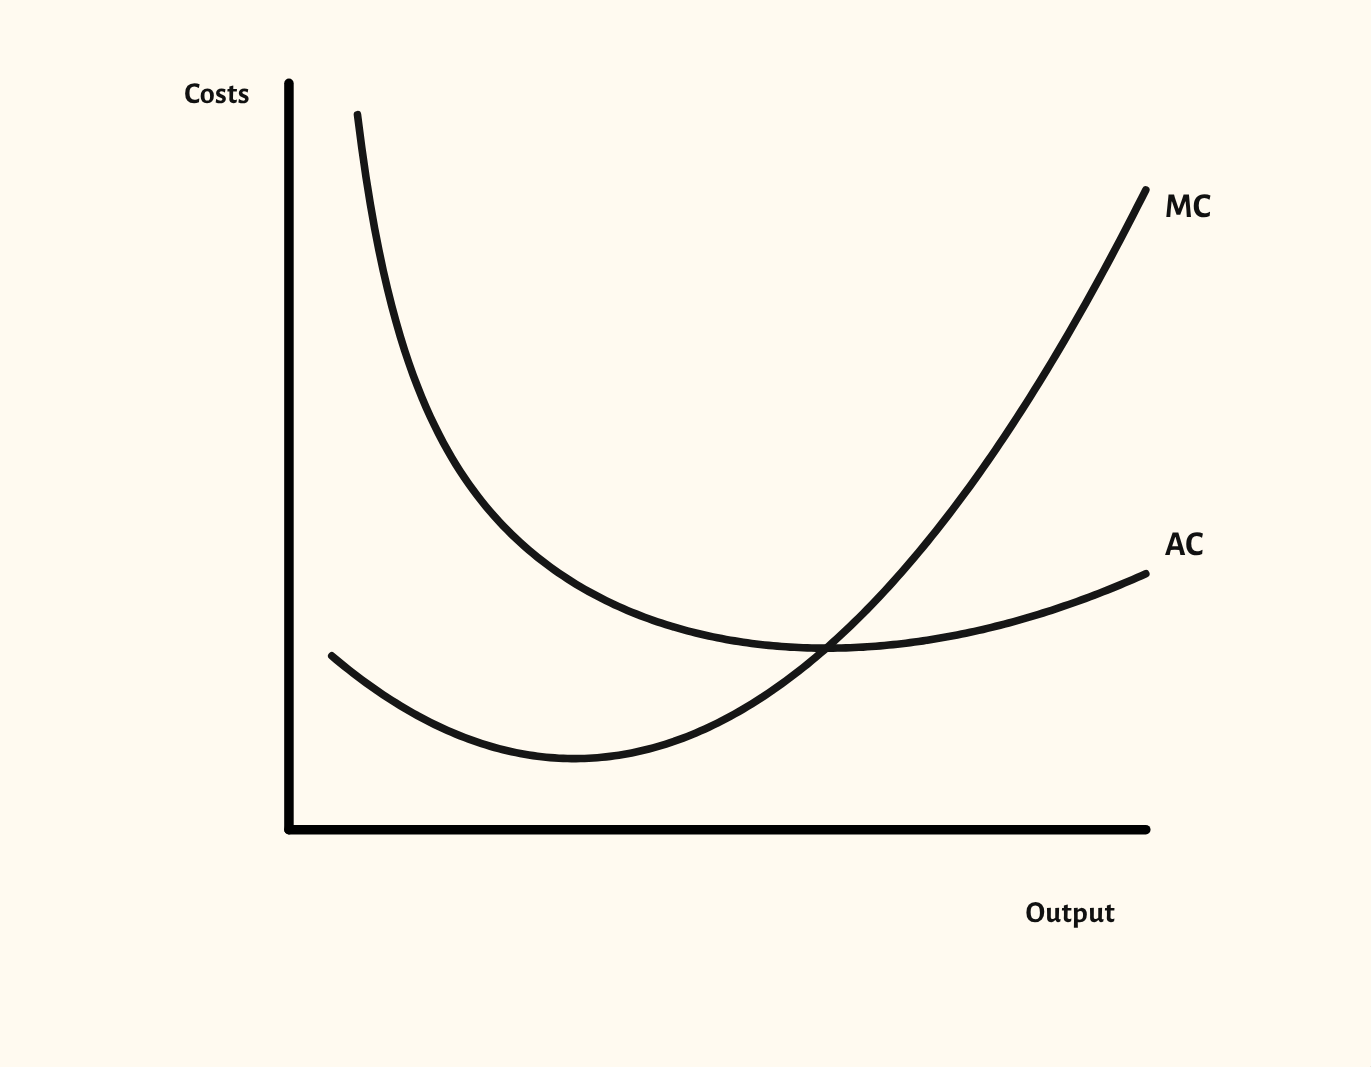
Every market structure diagram is built from the same cost and revenue curves, so it pays to teach them on their own first. The starting point shows marginal cost cutting average cost at its lowest point, the relationship examiners expect to see drawn accurately.
The product curves show where the cost curves get their shape. Marginal product rises at first, then falls once diminishing returns set in, so marginal cost falls and then rises: the MC curve is roughly the MP curve upside down. Marginal product cuts average product at its highest point, and total product is greatest where marginal product reaches zero.
The scenarios start with the product curves and maximum total product, then add the revenue curves, then supernormal profit, normal profit and a loss, and compare the outputs for profit maximisation, sales revenue maximisation and sales volume maximisation.
For Edexcel B, a break-even chart draws fixed costs, total cost and total revenue as straight lines, with the break-even output where total revenue equals total cost. Its scenarios show how a rise in fixed costs, a fall in price or a rise in variable costs means more must be sold to break even.
In a lesson, try asking the class why MC must cut AC at its lowest point before you add the revenue curves. Comparing the three business objectives on one diagram also makes a clear link to the theory of the firm.
What you can show
Each of these is one click in the diagram's Scenarios menu, and each starts from the plain diagram.
- Product curves
- Maximum total product
- Revenue curves
- Maximum total revenue
- Supernormal profit
- Normal profit
- Loss
- Profit maximisation
- Revenue maximisation
- Sales volume maximisation
- Profit, revenue and sales volume
- Allocative and productive efficiency
- Profit satisficing
- Growth
- X-inefficiency
- Break-even: fixed costs rise
- Break-even: price falls
- Break-even: variable costs rise
Exam boards
On the Edexcel A, Edexcel B, AQA, OCR, Eduqas, WJEC, Cambridge International and Edexcel International A-level specifications, drawn in exam style: black lines, clear labels and no grid.