
Economies of scale diagram
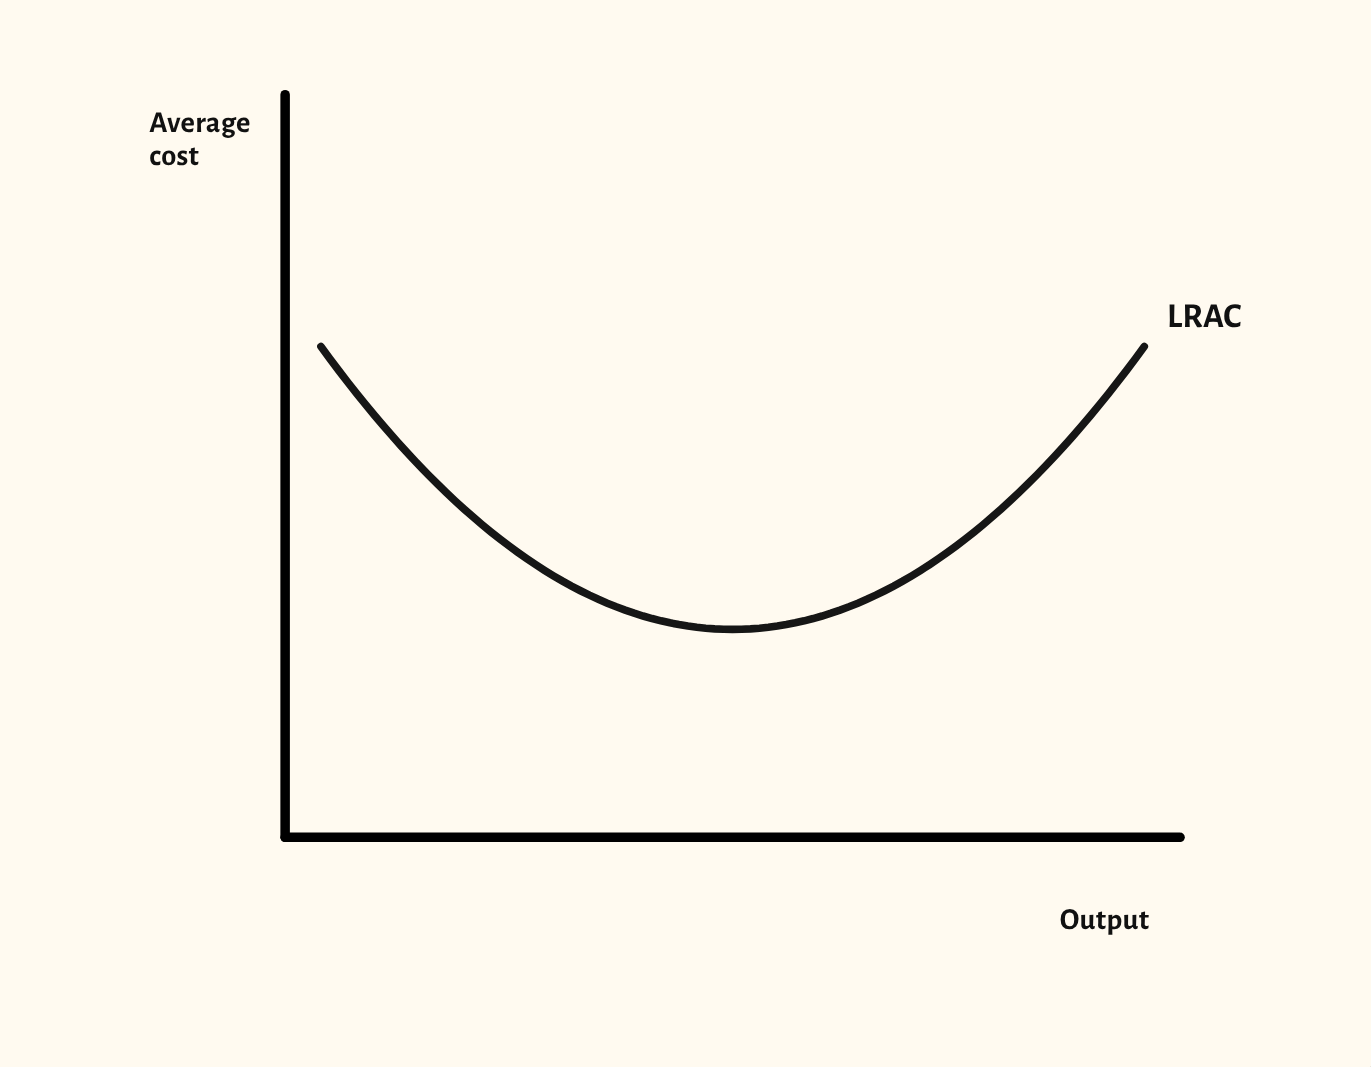
The long-run average cost curve, with economies and diseconomies of scale, minimum efficient scale and external economies.
Included in the school licence.
Teaching notes
The long-run average cost curve shows what happens to costs as a firm grows. The starting point shows a U-shaped LRAC curve, with economies of scale as it falls and diseconomies as it rises.
The scenarios mark economies of scale, minimum efficient scale and diseconomies of scale, then show constant average cost, an L-shaped LRAC, the short-run average cost curves beneath it, and external economies and diseconomies of scale as shifts of the whole curve.
In a lesson, try asking the class for real examples of each, such as bulk buying or management problems in a very large firm, before you show where they sit on the curve. Minimum efficient scale links neatly to why some industries have only a few firms.
What you can show
Each of these is one click in the diagram's Scenarios menu, and each starts from the plain diagram.
- Economies of scale
- Minimum efficient scale
- Diseconomies of scale
- Constant average cost
- L-shaped long-run average cost
- Economies and diseconomies of scale
- Constant returns to scale
- Short-run average cost curves
- External economies of scale
- External diseconomies of scale
Exam boards
On the Edexcel A, Edexcel B, AQA, OCR, Eduqas, WJEC, Cambridge International and Edexcel International A-level specifications, drawn in exam style: black lines, clear labels and no grid.