
Contestable markets diagram
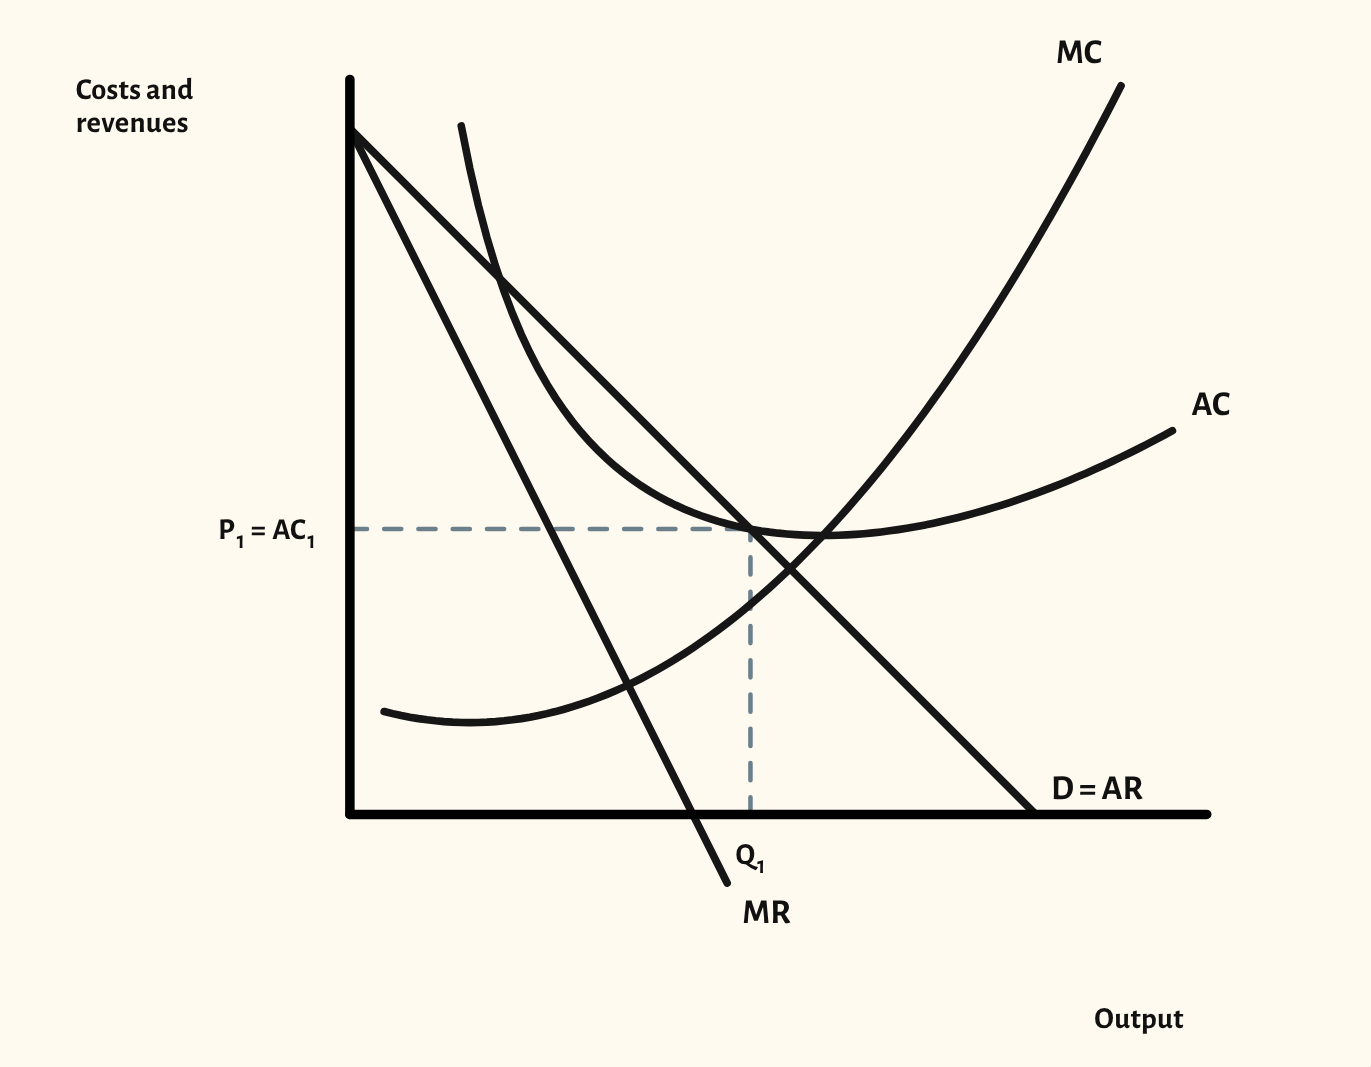
A firm in a contestable market pricing where AR = AC for normal profit, compared with the monopoly outcome.
Included in the school licence.
Teaching notes
Contestability turns on the threat of entry rather than the number of firms. The starting point shows a firm that prices where average revenue equals average cost, making only normal profit, because any more would attract new entrants.
The scenarios compare this with the monopoly outcome, first the price and output and then the profit area a monopolist would make if entry were blocked.
In a lesson, try asking the class what would happen if this firm raised its price to the monopoly level, then show the profit area that would tempt entrants in. It works well straight after the monopoly diagram.
What you can show
Each of these is one click in the diagram's Scenarios menu, and each starts from the plain diagram.
- Monopoly comparison
- Monopoly comparison – profit area
- Limit pricing
- Predatory pricing
Exam boards
On the Edexcel A, Edexcel B, AQA, OCR, Eduqas, WJEC, Cambridge International and Edexcel International A-level specifications, drawn in exam style: black lines, clear labels and no grid.