
Output gap diagram
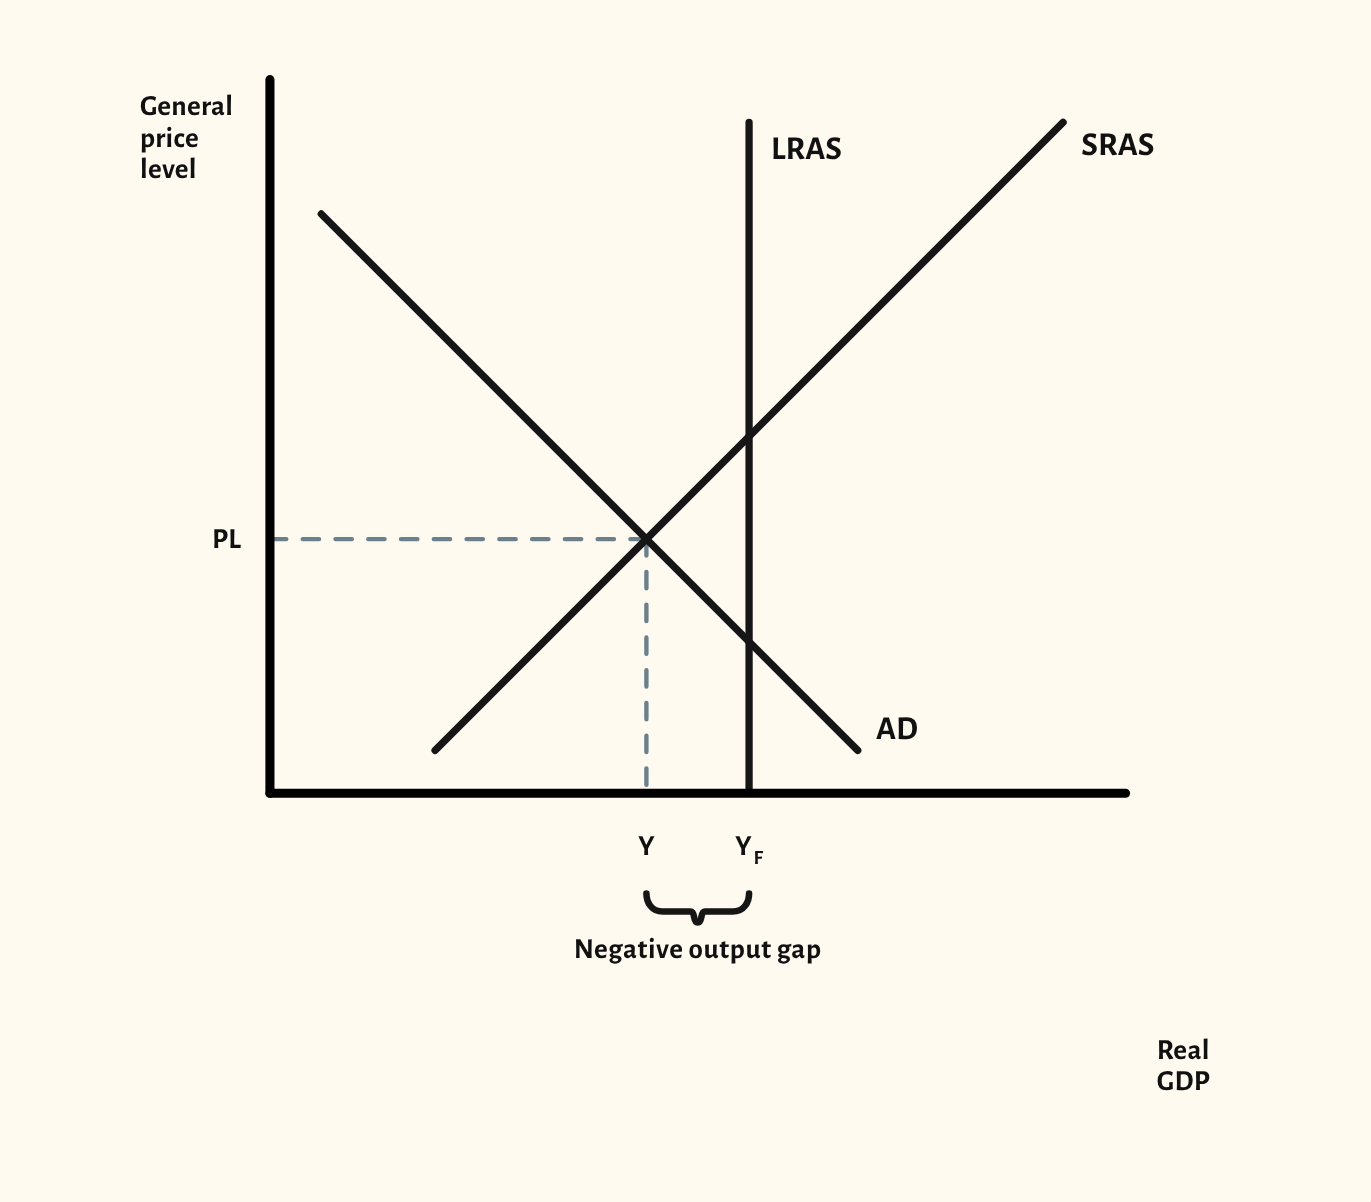
Positive and negative output gaps on the AD/AS model, and changes in AD and AS at the same time.
Included in the school licence.
Teaching notes
Output gaps measure how far the economy is from its full-capacity output. The starting point shows a negative output gap on the neo-classical model, with equilibrium output below full-capacity output and the gap marked on the axis.
The scenarios show no output gap, a positive output gap, a negative output gap on the Keynesian model, and AD and AS changing together on both models.
In a lesson, try asking the class what a negative output gap means for unemployment and inflation, then link it to the Phillips curve. The combined-change scenarios are useful practice for questions that describe two shocks at once.
What you can show
Each of these is one click in the diagram's Scenarios menu, and each starts from the plain diagram.
- No output gap
- Positive output gap
- Keynesian – negative output gap
- AD and AS both change – classical
- AD and AS both change – Keynesian
Exam boards
On the Edexcel A, Edexcel B, AQA, OCR, Eduqas, WJEC, Cambridge International and Edexcel International A-level specifications, drawn in exam style: black lines, clear labels and no grid.