
Phillips curve diagram
The short-run trade-off between inflation and unemployment, and why it disappears in the long run at the natural rate of unemployment.
Free, with no account needed.
Teaching notes
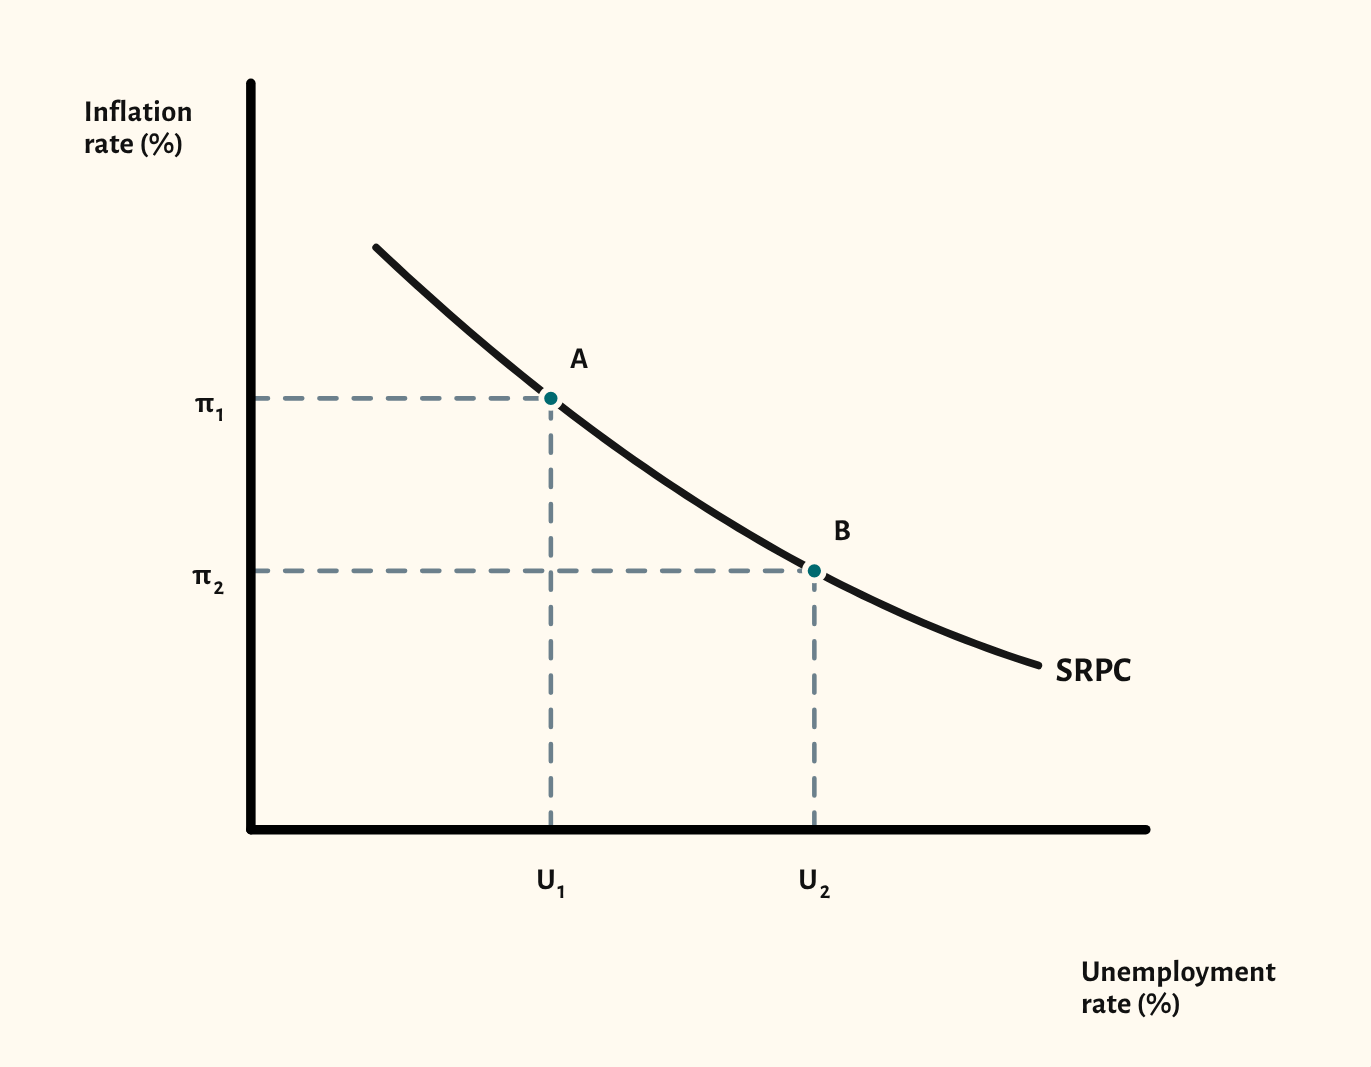
The short-run Phillips curve shows a trade-off: lower unemployment comes with higher inflation. Points A and B on the curve let you show a movement along it, with the inflation and unemployment rates marked on the axes.
The long-run view adds the vertical long-run Phillips curve at the natural rate of unemployment, labelled NAIRU. CueCurve treats the two names as the same point, as most A-level answers do, but some OCR and AQA mark schemes keep them apart, so it's worth telling the class which one your board expects. Step through the scenarios to show the expectations-augmented story: a short-run fall in unemployment below the natural rate, then adjustment back to it as expectations of inflation catch up, leaving higher inflation and no lasting gain in employment.
In a lesson, try asking the class what a government could do to reduce unemployment, showing the short-run gain, then asking what happens when workers expect the higher inflation. The final scenario shows the answer. It pairs well with the AD/AS diagram when teaching the link between demand-side policy and inflation.
What you can show
Each of these is one click in the diagram's Scenarios menu, and each starts from the plain diagram.
- Long run – the starting position
- Long run – a short-run fall in unemployment
- Long run – adjustment to the natural rate
Exam boards
On the Edexcel A, AQA, OCR, Eduqas, WJEC, Cambridge International and Edexcel International A-level specifications, drawn in exam style: black lines, clear labels and no grid.