
Keynesian and neo-classical AS diagrams
The Keynesian and neo-classical models of aggregate supply compared, with shifts in short-run and long-run AS.
Included in the school licence.
Teaching notes
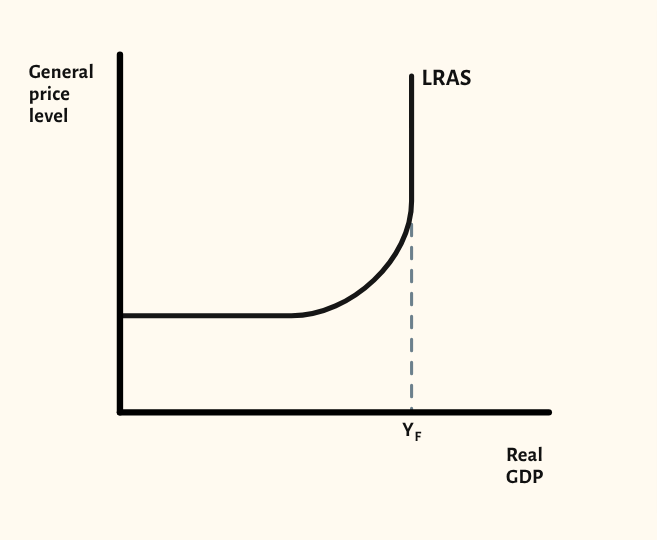
The two schools of thought on aggregate supply lead to very different policy conclusions, so it helps to see the models next to each other. The starting point shows the two models side by side: the Keynesian LRAS curve, flat with spare capacity, rising as bottlenecks appear and vertical at full capacity, and the neo-classical vertical LRAS with an upward-sloping SRAS.
The scenarios show short-run and long-run shifts in AS on the Keynesian model, then shifts in SRAS and LRAS on the neo-classical model, where long-run supply is vertical.
In a lesson, try asking the class what each model predicts about a rise in AD at different levels of output, and which they think fits the UK economy today. It is a good way into evaluation.
What you can show
Each of these is one click in the diagram's Scenarios menu, and each starts from the plain diagram.
- Keynesian – short-run and long-run shifts in AS
- Classical – shifts in SRAS and LRAS
Exam boards
On the Edexcel A, Edexcel B, AQA, OCR, Eduqas, WJEC, Cambridge International and Edexcel International A-level specifications, drawn in exam style: black lines, clear labels and no grid.