
J-curve diagram
How the current account worsens and then improves after a depreciation, and the Marshall–Lerner condition.
Included in the school licence.
Teaching notes
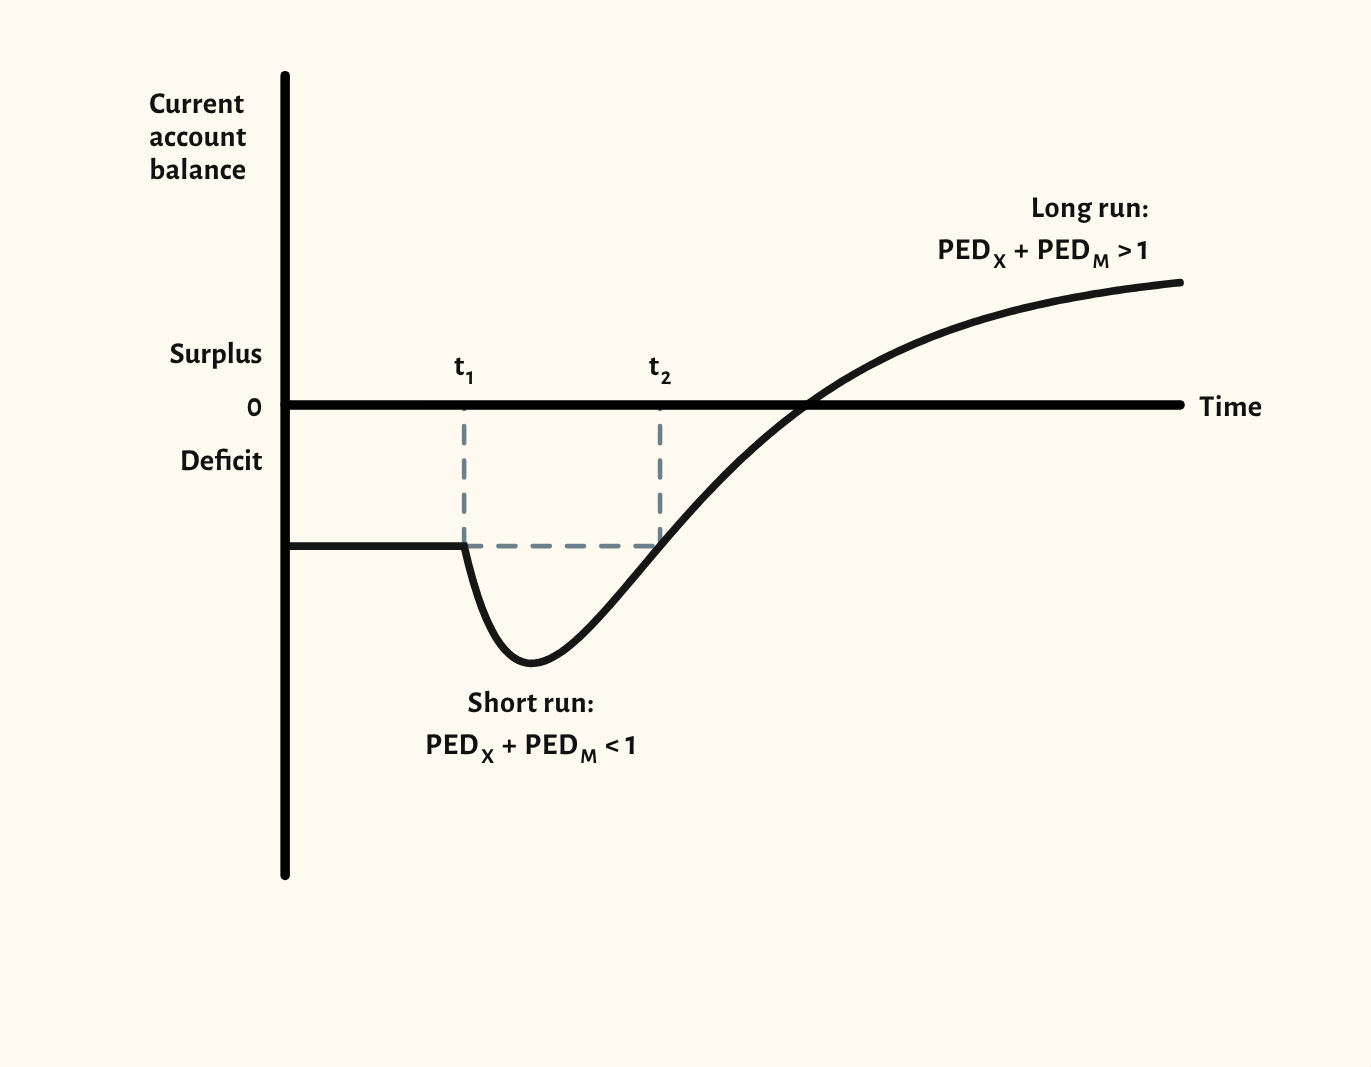
The J-curve shows why a depreciation can make the current account worse before it makes it better. The starting point shows the balance over time, dipping after the depreciation while demand for exports and imports is inelastic, then recovering as the combined elasticities rise above one.
The time axis names each phase: the depreciation, the time when volumes are slow to respond, and the recovery. The scenarios compare a larger and a smaller depreciation, and show what happens when the Marshall–Lerner condition is not met.
In a lesson, try asking the class why import spending might rise just after a depreciation, before you show the dip. It follows on naturally from the exchange rate diagram.
What you can show
Each of these is one click in the diagram's Scenarios menu, and each starts from the plain diagram.
- Larger depreciation
- Smaller depreciation
- Marshall–Lerner not met
Exam boards
On the Edexcel A, OCR, Eduqas, WJEC, Cambridge International and Edexcel International A-level specifications, drawn in exam style: black lines, clear labels and no grid.