
Exchange rate diagram
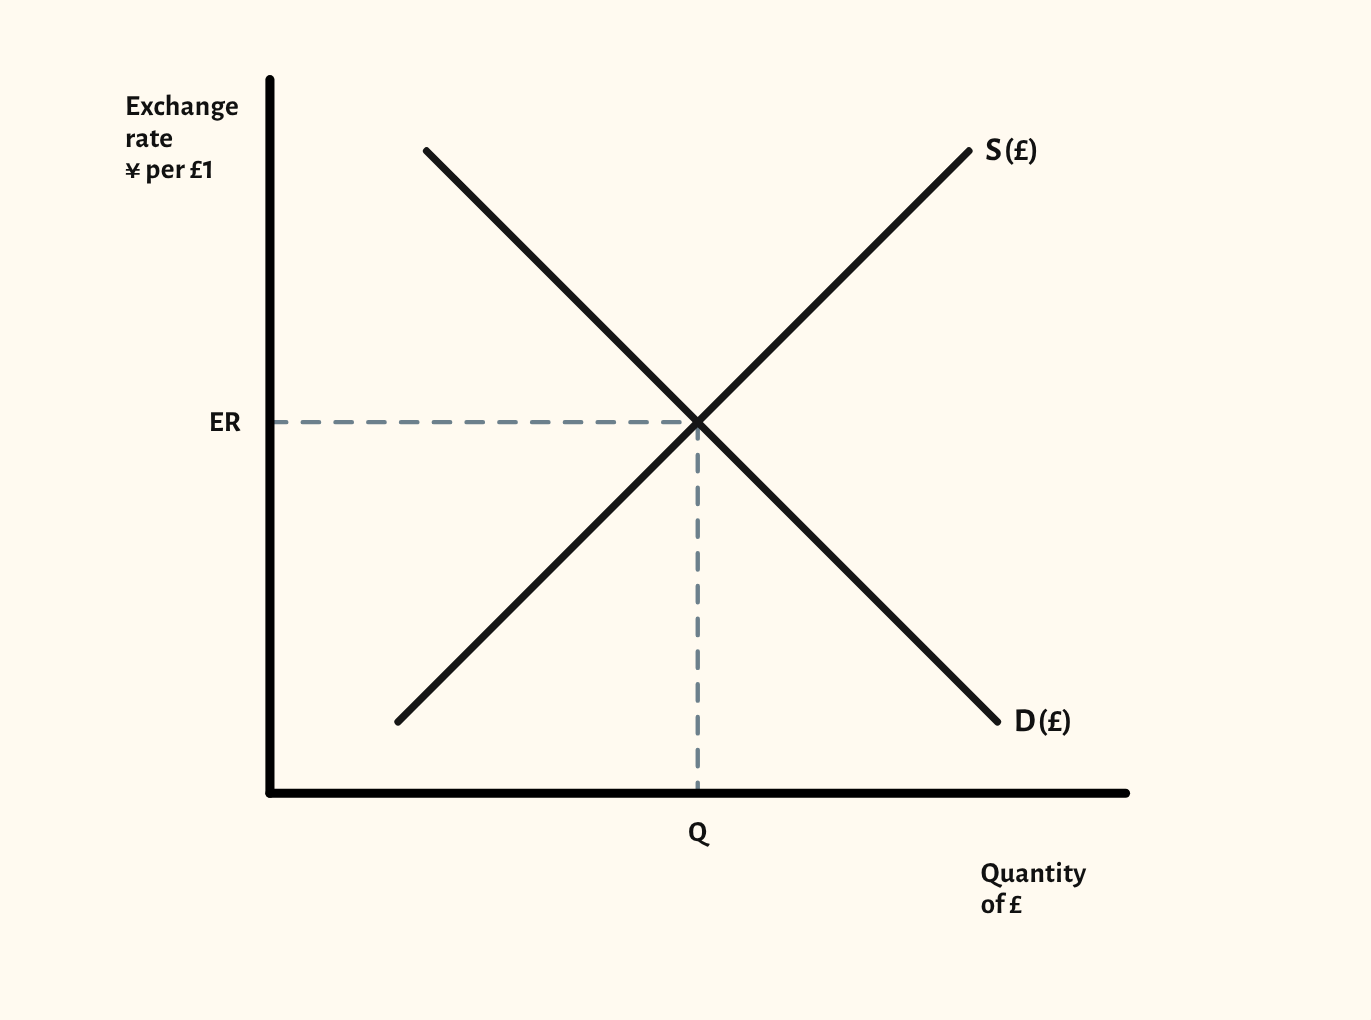
Supply and demand for the pound, with appreciation, depreciation, and fixed and managed exchange rates.
Included in the school licence.
Teaching notes
An exchange rate is a price, so the diagram is supply and demand for a currency. The starting point shows the market for pounds, with the exchange rate in yen per pound and the equilibrium rate marked.
The scenarios cover appreciation from a rise in demand or a fall in supply, depreciation from a fall in demand or a rise in supply, a combined change, a fixed exchange rate held above or below the market rate, and a managed float. In the managed float scenarios the rate can move within a band, drawn as two dashed lines, and the central bank buys or sells pounds when the rate would leave it.
In a lesson, try asking the class who demands pounds and who supplies them, then which way a UK interest rate rise or a fall in exports would move each curve, before you show it. It leads on to the J-curve.
What you can show
Each of these is one click in the diagram's Scenarios menu, and each starts from the plain diagram.
- Appreciation – increase in demand
- Depreciation – decrease in demand
- Depreciation – increase in supply
- Appreciation – decrease in supply
- Depreciation – demand falls, supply rises
- Managed float – central bank buys pounds
- Managed float – central bank sells pounds
- Fixed exchange rate – above the market rate
- Fixed exchange rate – below the market rate
Exam boards
On the Edexcel A, Edexcel B, AQA, OCR, Eduqas, WJEC, Cambridge International and Edexcel International A-level specifications, drawn in exam style: black lines, clear labels and no grid.