
Tariff and comparative advantage diagrams
Free trade at the world price, tariffs and quotas with their welfare effects, trade creation and trade diversion, comparative advantage with the gains from trade, and the terms of trade.
Included in the school licence.
Teaching notes
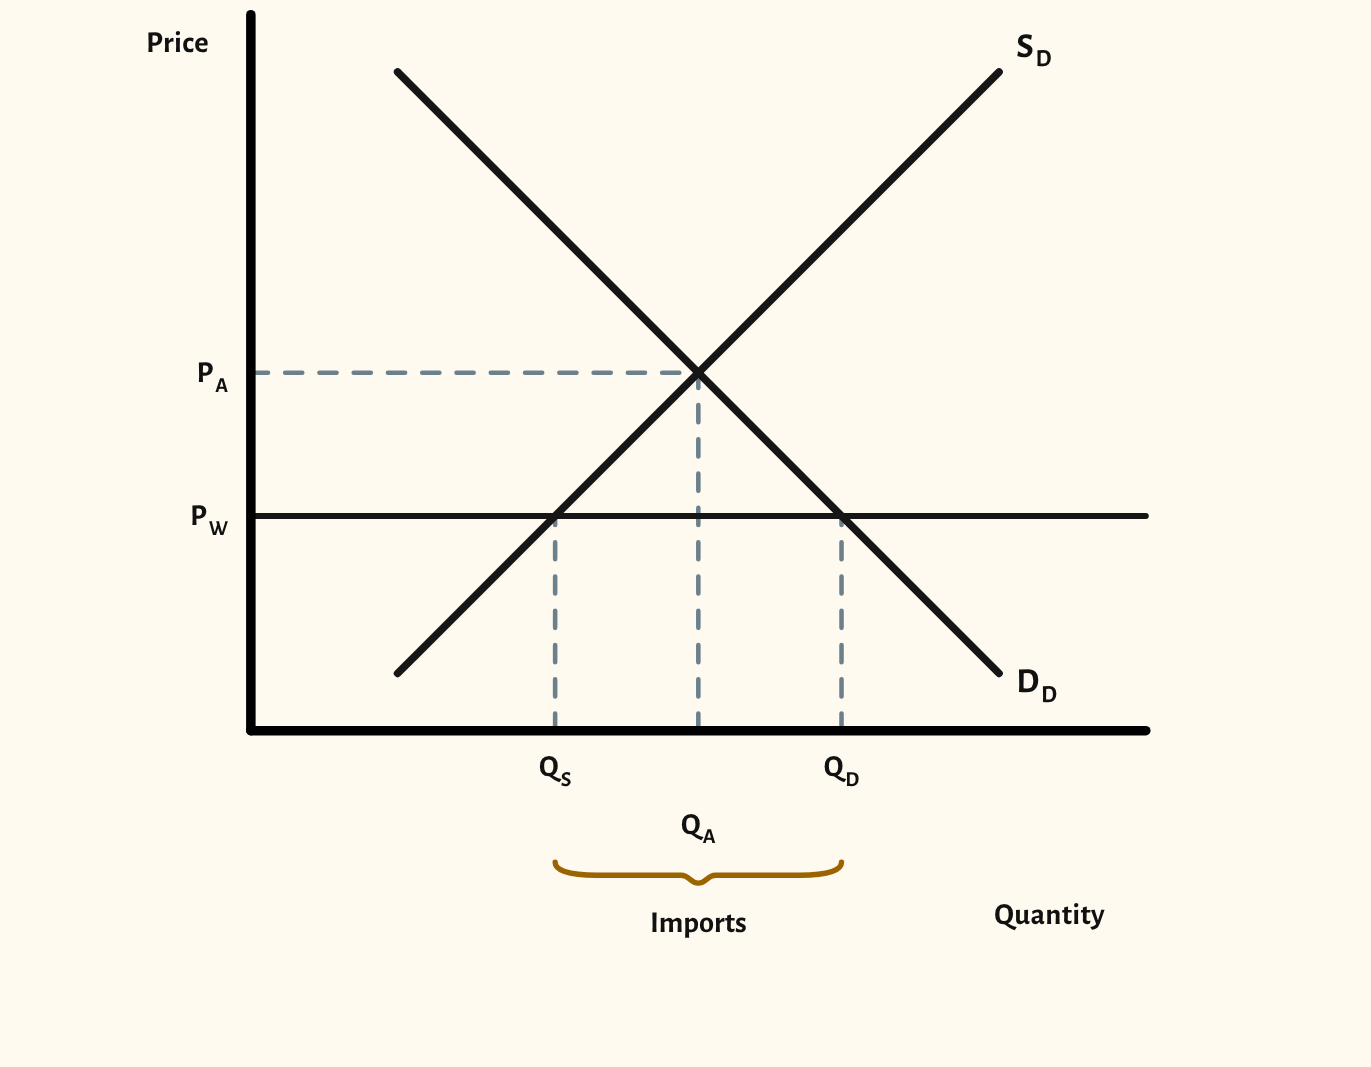
Protectionism diagrams are crowded, so it helps to build them in stages. The starting point shows free trade at the world price, with domestic supply, domestic demand and the imports between them marked.
The scenarios cover exports at the world price, no trade, a tariff and its welfare effects, a quota and its welfare effects, a tariff and a quota compared, and trade creation and trade diversion in a customs union with their welfare effects. A key under each welfare diagram names the areas, such as the welfare loss and who gets area C.
The comparative advantage type draws two countries' straight-line production possibility frontiers on one diagram. Step through specialisation, the trading possibility curves at the terms of trade, and the consumption points beyond each frontier that show the gains from trade. Drag a frontier in or out, change how much of each good a country can make, or move the terms of trade between the two opportunity costs. The scenarios include a country with an absolute advantage in both goods, which still gains from trade, and two countries with equal opportunity costs, which don't. The terms of trade scenario adds a table of each country's opportunity costs and shades the range of terms of trade at which both countries gain.
The terms of trade index type works like the multiplier calculations: the export price index divided by the import price index, times 100. Change either price index and the card says whether the terms of trade have improved or worsened since the base year.
In a lesson, try asking the class who gains and who loses from a tariff before you shade the welfare effects. Comparing the tariff with the quota scenario shows why the two have different effects on government revenue.
What you can show
Each of these is one click in the diagram's Scenarios menu, and each starts from the plain diagram.
- Exports at the world price
- No trade
- Tariff
- Tariff – welfare effects
- Quota
- Quota – welfare effects
- Tariff and quota compared
- Trade creation
- Trade creation – welfare effects
- Trade diversion
- Trade diversion – welfare effects
- Comparative advantage
- Specialisation
- Gains from trade
- Terms of trade
- Terms of trade index – an improvement
- Terms of trade index – a deterioration
- Absolute advantage in both goods
- Equal opportunity costs
Exam boards
On the Edexcel A, Edexcel B, AQA, OCR, Eduqas, WJEC, Cambridge International and Edexcel International A-level specifications, drawn in exam style: black lines, clear labels and no grid.