
Labour market diagram
Wages set by the supply of and demand for labour, with economic rent, transfer earnings and the wage-taking firm.
Included in the school licence.
Teaching notes
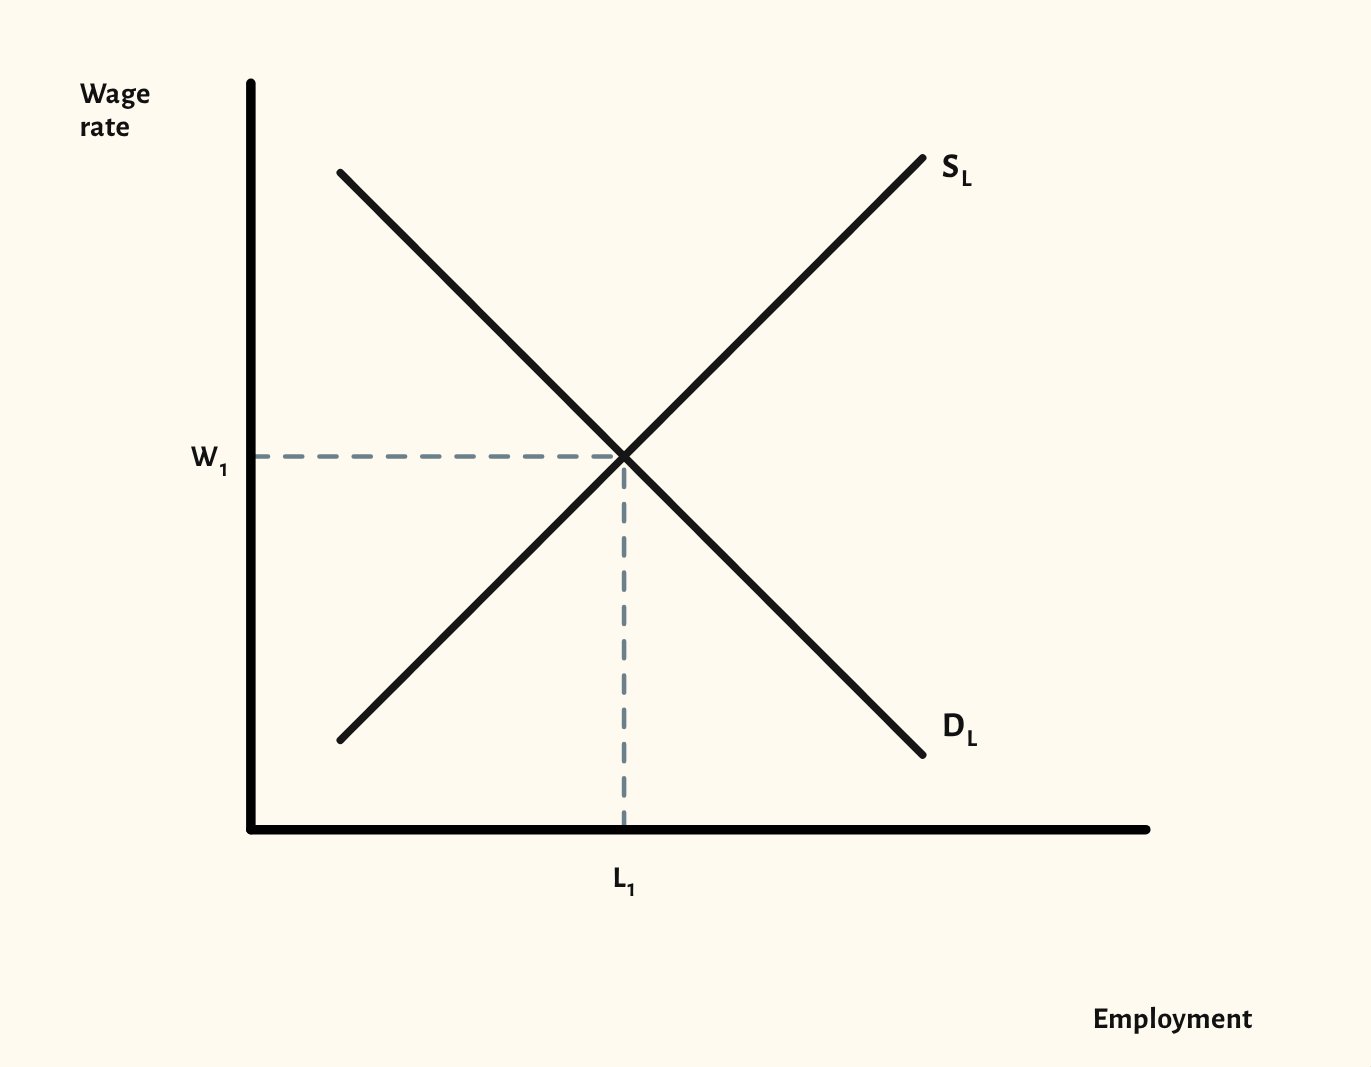
A competitive labour market is supply and demand with wages on the vertical axis and employment on the horizontal. The starting point shows the market wage and employment where the demand for and supply of labour meet.
The scenarios show a market with inelastic labour supply, economic rent and transfer earnings, and a single wage-taking firm that has to accept the market wage.
In a lesson, try asking the class why a top footballer earns so much more than a nurse, then use the economic rent scenario to separate what keeps them in the job from the rest of their pay. It sets up labour market power next.
What you can show
Each of these is one click in the diagram's Scenarios menu, and each starts from the plain diagram.
- Migration raises labour supply
- Demand for the product falls
- Higher productivity raises labour demand
- Inelastic supply of labour
- Economic rent and transfer earnings
- A wage-taking firm
Exam boards
On the Edexcel A, Edexcel B, AQA, OCR, Eduqas, WJEC, Cambridge International and Edexcel International A-level specifications, drawn in exam style: black lines, clear labels and no grid.