
Trade union and monopsony diagrams
Trade unions, the national minimum wage, a maximum wage, monopsony employers and bilateral monopoly, on labour market diagrams.
Included in the school licence.
Teaching notes
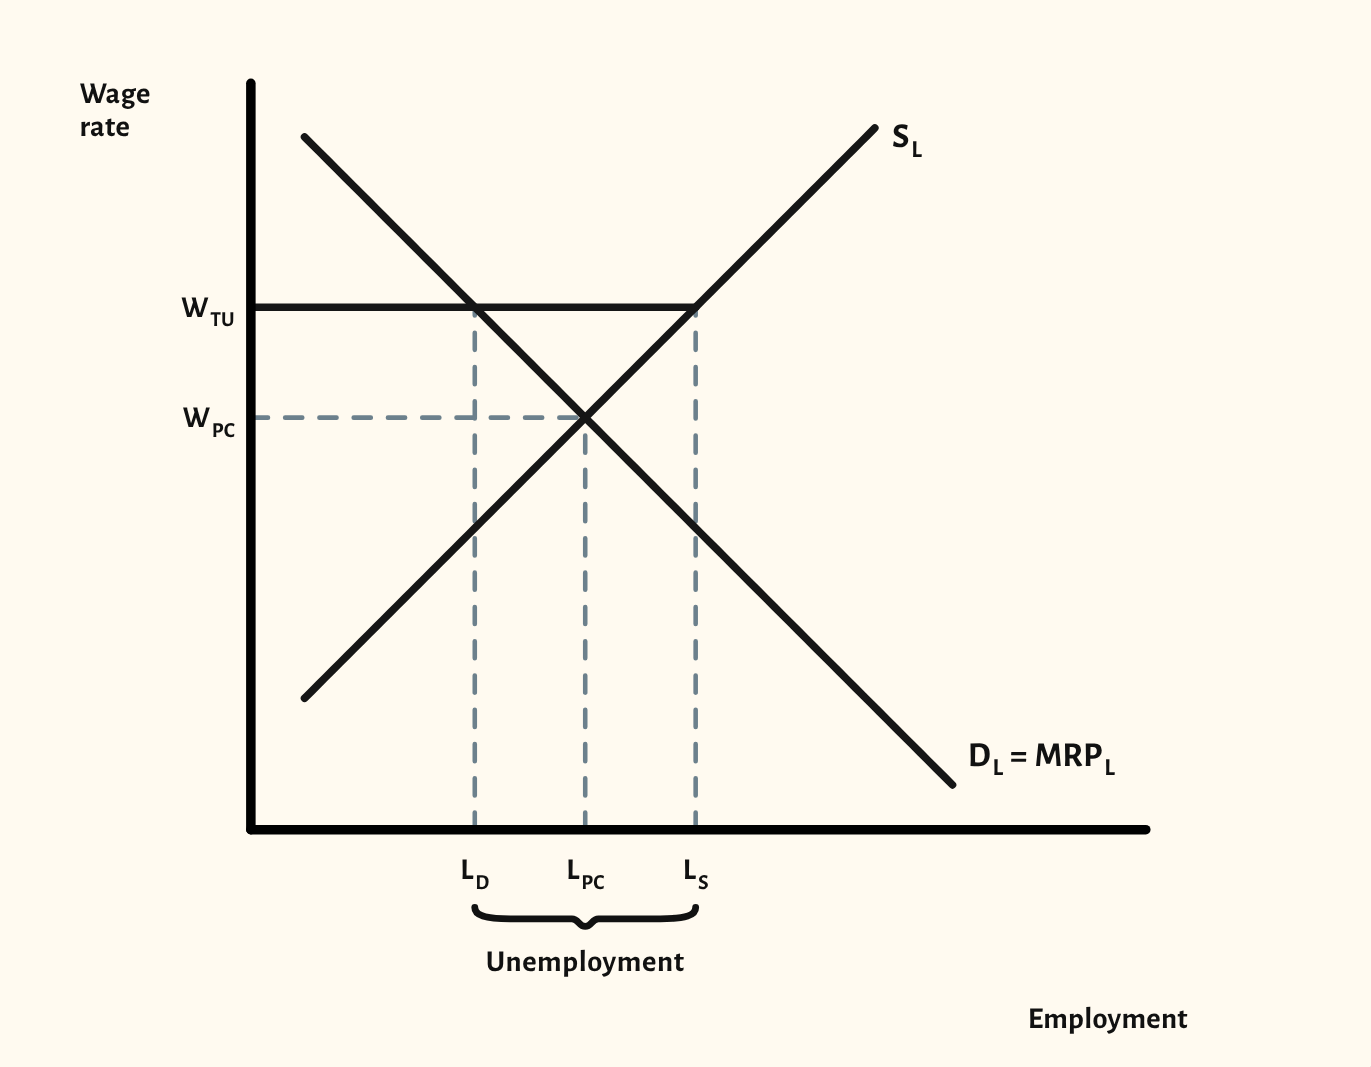
Labour market power is where wages are no longer set by a competitive market. The starting point shows a trade union pushing the wage above the competitive level, with the resulting unemployment marked between the labour demanded and supplied.
The scenarios cover the national minimum wage, a maximum wage and the shortage of labour it creates, a monopsony employer paying below the competitive wage, a minimum wage in a monopsony, and bilateral monopoly, where a union faces a monopsony and can push the wage up to the marginal revenue product at the monopsony's employment.
In a lesson, try asking the class whether a minimum wage must cause unemployment, then use the minimum wage in monopsony scenario to show why not: set between the monopsony wage and the competitive wage, the minimum wage makes the firm's marginal cost of labour flat up to the supply curve, so pay and employment both rise. Drag the minimum wage above the competitive wage to show when unemployment does appear.
What you can show
Each of these is one click in the diagram's Scenarios menu, and each starts from the plain diagram.
- Minimum wage
- Minimum wage rises
- Maximum wage
- Monopsony
- Minimum wage in monopsony
- Bilateral monopoly
Exam boards
On the Edexcel A, Edexcel B, AQA, OCR, Eduqas, WJEC, Cambridge International and Edexcel International A-level specifications, drawn in exam style: black lines, clear labels and no grid.