
Economic cycle diagram
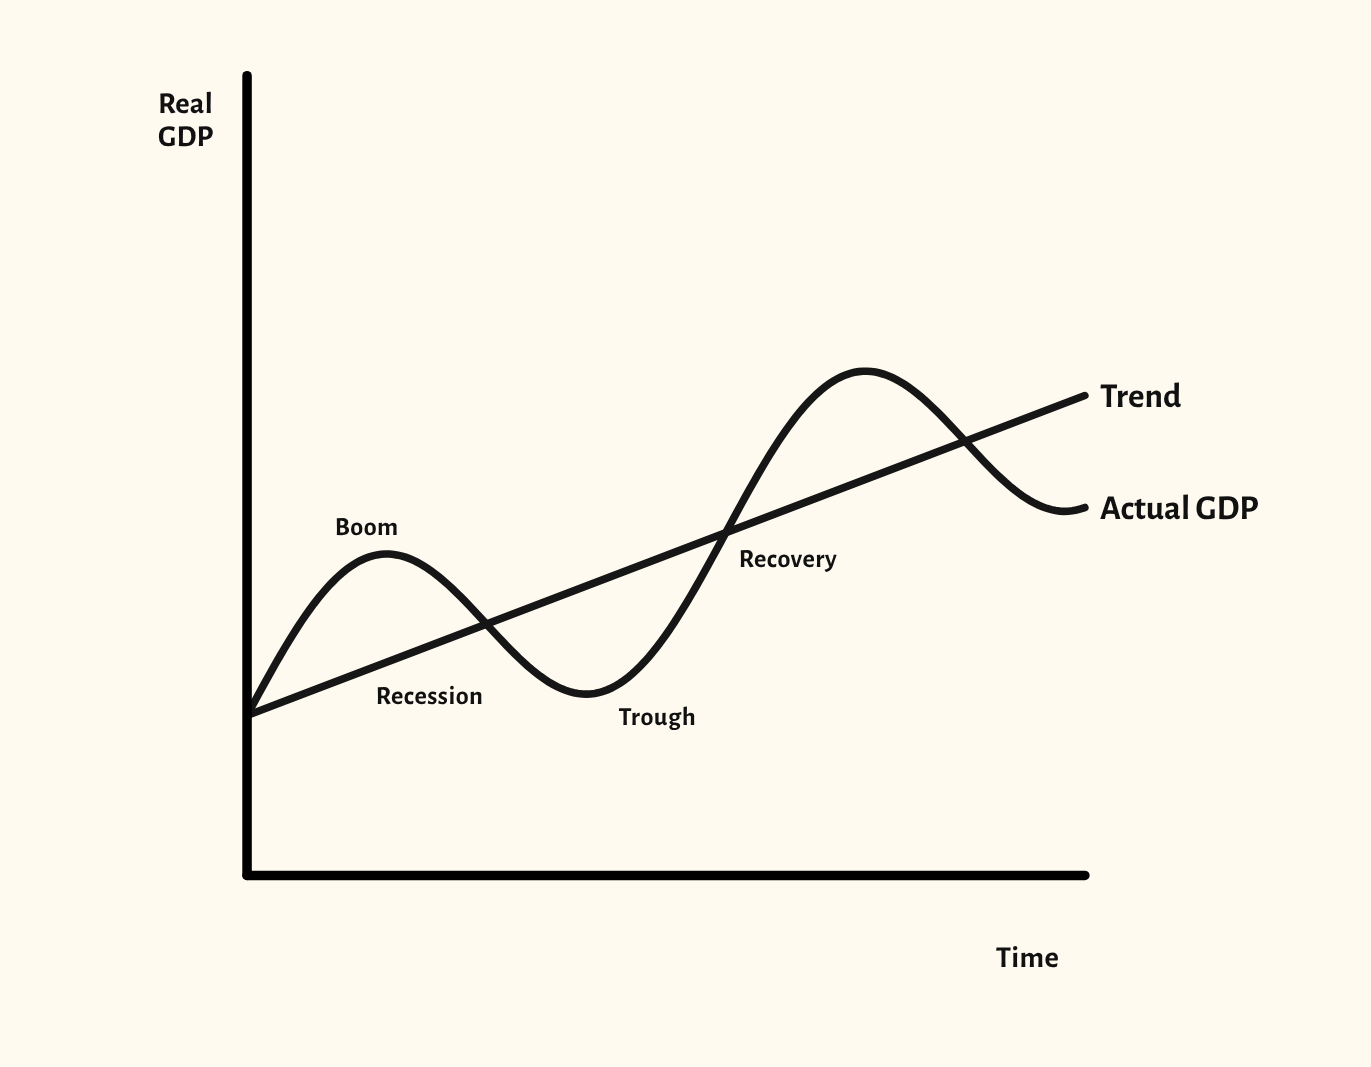
Actual GDP moving around its trend through boom, recession, trough and recovery, with positive and negative output gaps.
Included in the school licence.
Teaching notes
The economic cycle diagram separates two ideas students often run together: the trend rate of growth, and the swings of actual GDP around it. The starting point shows actual GDP moving through boom, recession, trough and recovery while the trend keeps rising.
The scenarios mark the positive and negative output gaps, make the swings in the cycle bigger, and show what faster or slower trend growth does to the path of real GDP.
In a lesson, try asking the class where an output gap is positive and what that suggests about inflation. Then compare a bigger swing with faster trend growth, and ask which one a government would rather have.
What you can show
Each of these is one click in the diagram's Scenarios menu, and each starts from the plain diagram.
- Positive and negative output gaps
- Bigger swings in the cycle
- Faster trend growth
- Slower trend growth
Exam boards
On the Edexcel A, Edexcel B, AQA, OCR, Eduqas, WJEC, Cambridge International and Edexcel International A-level specifications, drawn in exam style: black lines, clear labels and no grid.