
Fiscal and monetary policy diagrams
Fiscal, monetary and supply-side policy on the AD/AS model, plus the Laffer curve.
Included in the school licence.
Teaching notes
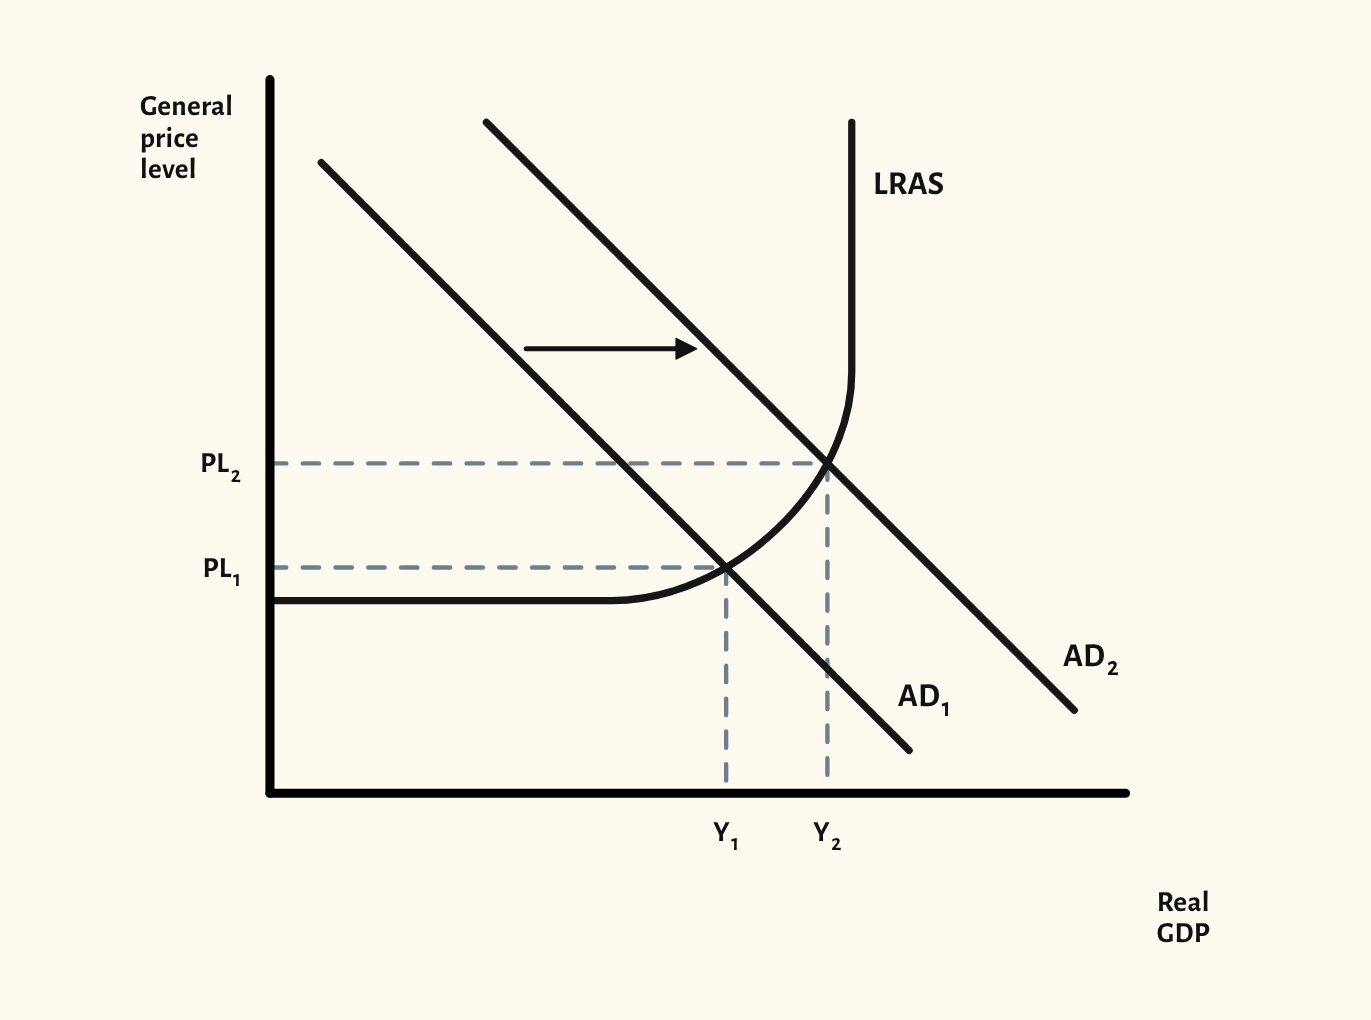
Policy questions ask the class to show both what a policy does and why its effect depends on the state of the economy. The starting point shows an expansionary policy shifting AD to the right against a Keynesian LRAS curve.
The scenarios cover a contractionary fiscal policy, expansionary and contractionary monetary policy, and supply-side policy on both the Keynesian and neo-classical models. The Laffer curve is there too, for the link between tax rates and tax revenue, which is zero at both a 0% and a 100% tax rate.
In a lesson, try comparing a demand-side and a supply-side policy aimed at the same goal, asking the class which raises output with less inflation, then stepping through the two scenarios to check.
What you can show
Each of these is one click in the diagram's Scenarios menu, and each starts from the plain diagram.
- Contractionary fiscal policy – spending cut
- The Laffer curve
- Expansionary monetary policy – rate cut
- Contractionary monetary policy – rate rise
- Supply-side policy – Keynesian LRAS
- Supply-side policy – classical LRAS
Exam boards
On the Edexcel A, Edexcel B, AQA, OCR, Eduqas, WJEC, Cambridge International and Edexcel International A-level specifications, drawn in exam style: black lines, clear labels and no grid.