
Economic growth diagram
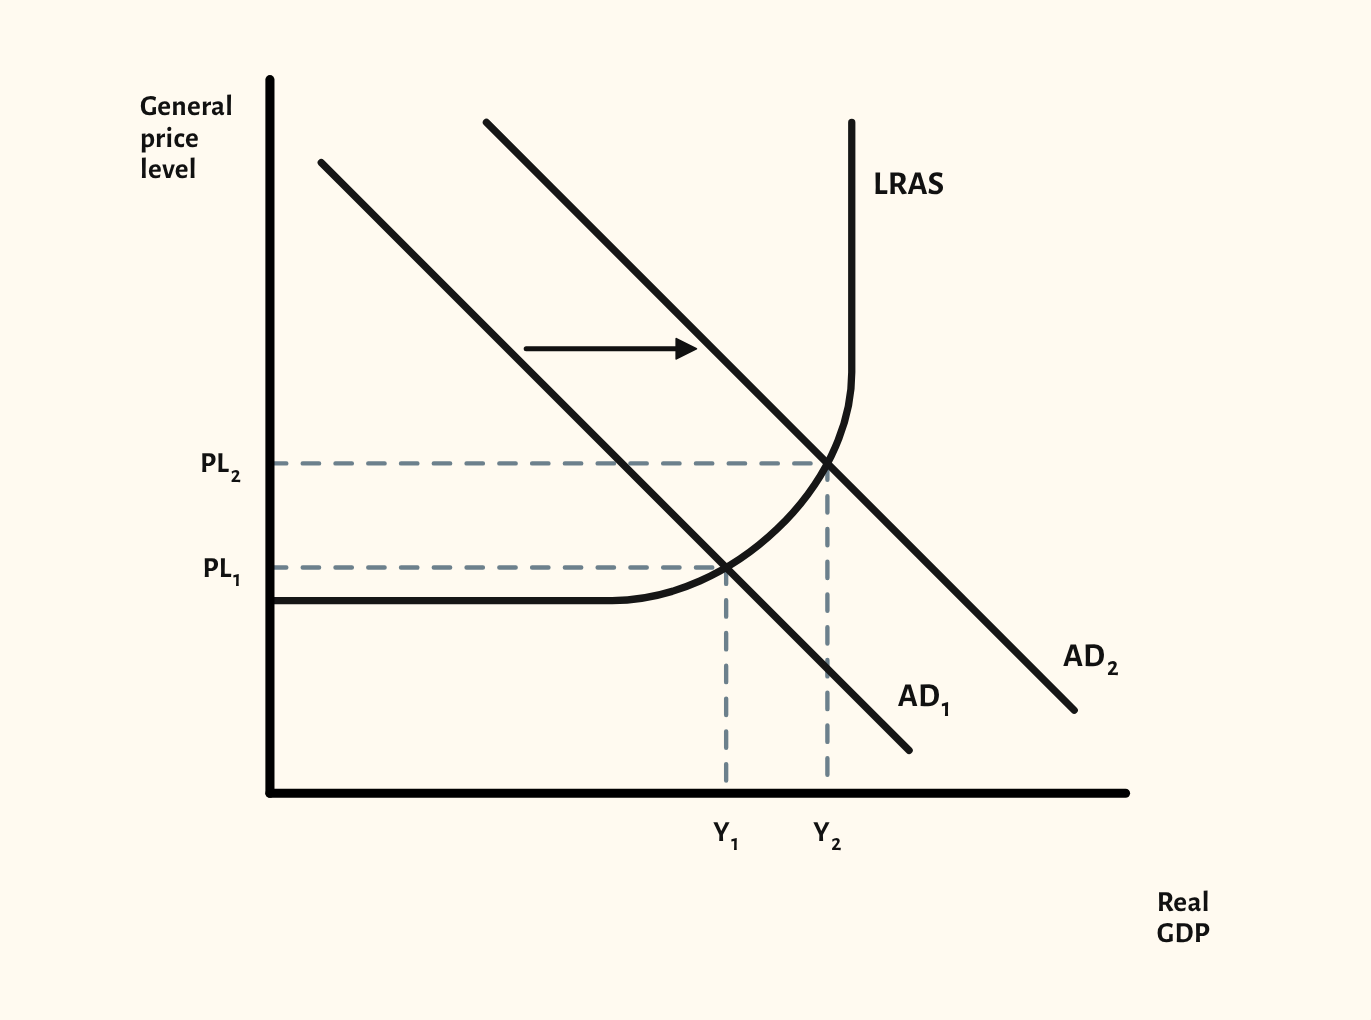
Short-run growth from a rise in AD, and long-run growth from a rise in LRAS, on the Keynesian and neo-classical models.
Included in the school licence.
Teaching notes
The difference between short-run and long-run growth is a favourite exam distinction, and this diagram puts both on the AD/AS model. The starting point shows aggregate demand rising against a Keynesian LRAS curve, with real GDP and the price level both increasing.
The scenarios compare short-run growth with spare capacity, a rise in AD at full capacity that brings no real growth, and long-run growth from an increase in LRAS on both the Keynesian and neo-classical models.
In a lesson, try asking the class why the same rise in AD raises output in one scenario and only prices in another. Then show how an increase in LRAS lets output grow without the same pressure on prices.
What you can show
Each of these is one click in the diagram's Scenarios menu, and each starts from the plain diagram.
- Short-run growth – spare capacity
- AD increase at full capacity – no real growth
- Long-run growth – Keynesian LRAS
- Long-run growth – classical LRAS
Exam boards
On the Edexcel A, Edexcel B, AQA, OCR, Eduqas, WJEC, Cambridge International and Edexcel International A-level specifications, drawn in exam style: black lines, clear labels and no grid.