
Lorenz curve and Gini coefficient diagram
Reading the Lorenz curve against the line of equality, comparing distributions and showing the Gini coefficient.
Included in the school licence.
Teaching notes
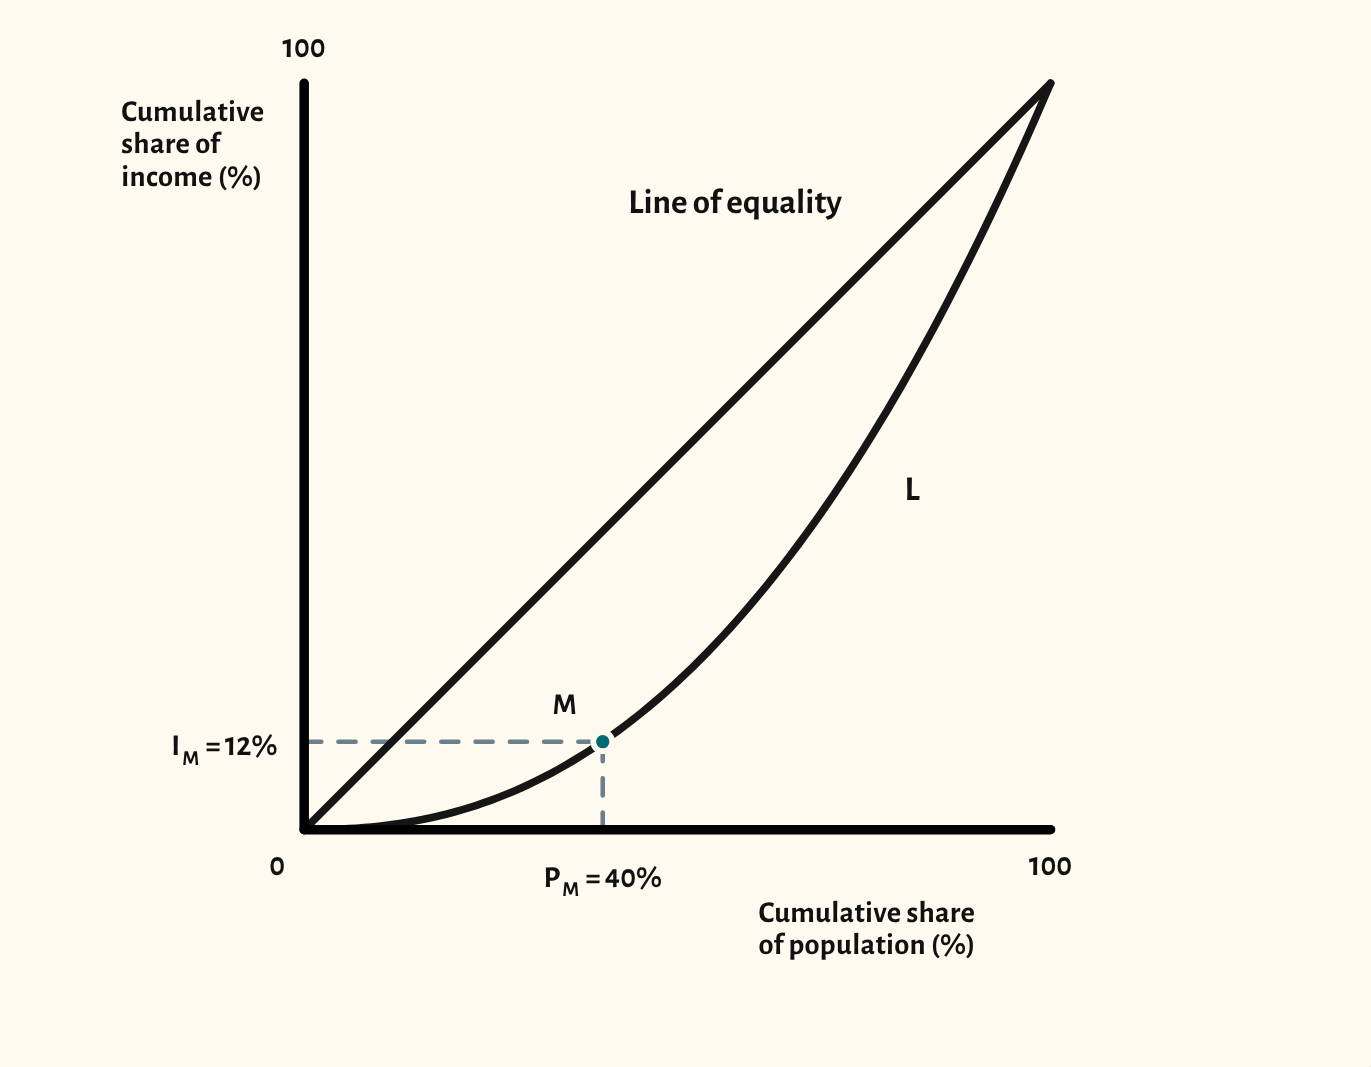
The Lorenz curve shows how equally income is shared. The starting point shows a curve below the line of equality, with a point marked to read off: here, the poorest 40% of the population receive 12% of income.
The scenarios show a more equal and a more unequal distribution, two distributions compared on one diagram, and the Gini coefficient, worked out from the area between the line of equality and the curve (A) and the area beneath the curve (B).
In a lesson, try asking the class to read off other points before showing the comparison, then ask what a policy such as a progressive income tax would do to the curve.
What you can show
Each of these is one click in the diagram's Scenarios menu, and each starts from the plain diagram.
- More equal distribution
- More unequal distribution
- Comparing two distributions
- Gini coefficient
Exam boards
On the Edexcel A, Edexcel B, AQA, OCR, Cambridge International and Edexcel International A-level specifications, drawn in exam style: black lines, clear labels and no grid.