
Circular flow of income diagram
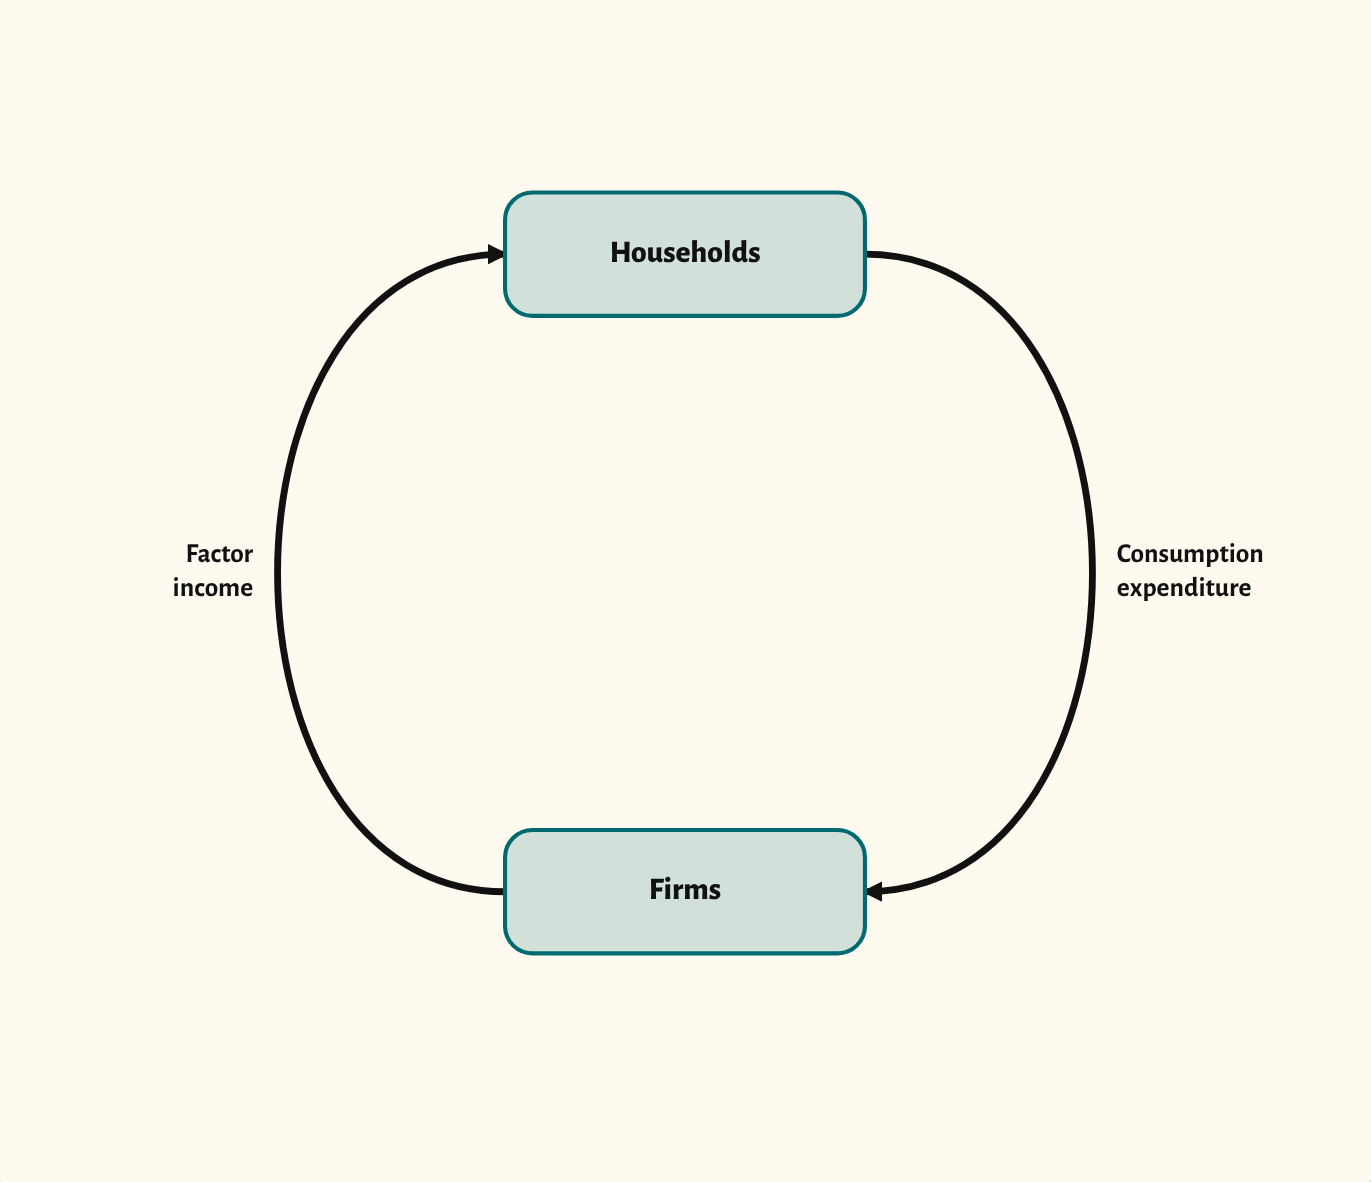
Households and firms with the flows of income and spending between them, then injections and withdrawals one at a time.
Included in the school licence.
Teaching notes
The circular flow of income is the starting point for macroeconomics: it shows national income as spending that goes round between households and firms. The starting point shows the two sectors, with factor income flowing one way and consumption expenditure the other.
The scenarios build it up step by step: real and money flows, then injections and withdrawals, then the effect of an increase in investment, government spending or exports, and of an increase in saving, taxation or imports.
In a lesson, try asking the class to sort a list of flows into injections and withdrawals before you show them on the diagram. It sets up aggregate demand and, in Year 13, the multiplier.
What you can show
Each of these is one click in the diagram's Scenarios menu, and each starts from the plain diagram.
- Real and money flows
- Injections and withdrawals
- Increase in investment
- Increase in government spending
- Increase in exports
- Increase in saving
- Increase in taxation
- Increase in imports
Exam boards
On the Edexcel A, Edexcel B, AQA, OCR, Eduqas, WJEC, Cambridge International and Edexcel International A-level specifications, drawn in exam style: black lines, clear labels and no grid.