
Multiplier diagram
The multiplier as rounds of spending round the circular flow, with worked calculations, income determination on the 45° line and the accelerator.
Included in the school licence.
Teaching notes
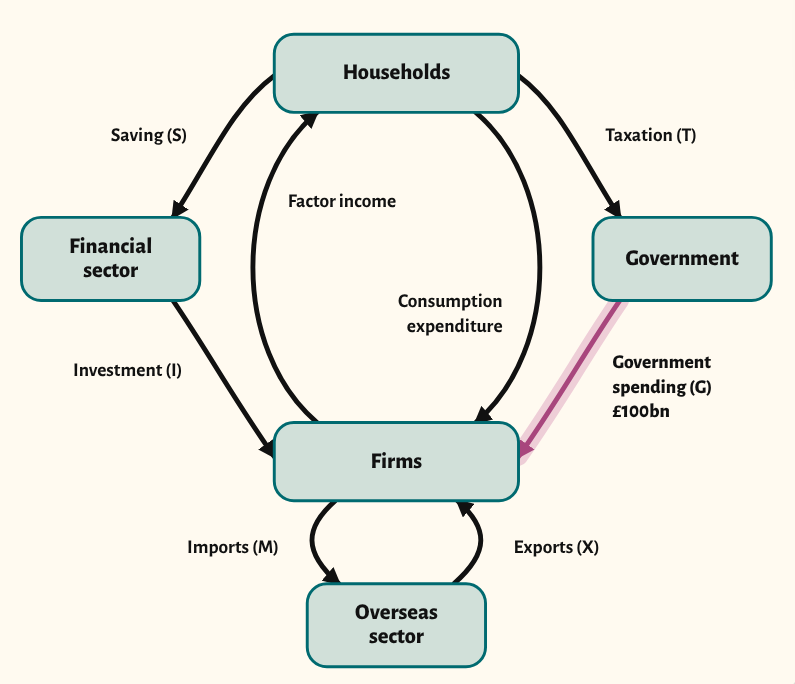
The multiplier is easiest to understand as money going round the circular flow, with some leaking out each time. The starting point shows the full five-sector circular flow with an injection of £100bn of government spending.
The scenarios follow the first and second rounds of spending and the total change in income, then show how a larger withdrawal rate gives a smaller multiplier. Three calculation scenarios cover the change in income, the injection needed and the marginal propensity to withdraw.
The income determination type draws aggregate expenditure meeting the 45° line, where AE = Y. An injection shifts AE up by ΔJ and raises income by k × ΔJ. The accelerator type is a time chart: net investment rises while the growth of real GDP speeds up, and falls once growth slows, even though real GDP is still rising.
In a lesson, try stepping through the rounds of spending and asking the class to predict the next round before you show it. The calculation scenarios make good practice for the numerical questions.
What you can show
Each of these is one click in the diagram's Scenarios menu, and each starts from the plain diagram.
- First round of spending
- Second round of spending
- The total change in income
- A larger withdrawal rate – a smaller multiplier
- Calculate the change in income
- Calculate the injection needed
- Calculate the marginal propensity to withdraw
- Income determination – the 45° line
- 45° line – an injection raises income
- The accelerator – investment and growth
Exam boards
On the Edexcel A, Edexcel B, AQA, OCR, Eduqas, WJEC, Cambridge International and Edexcel International A-level specifications, drawn in exam style: black lines, clear labels and no grid.