
Production possibility frontier diagram
Scarcity, choice and opportunity cost on one curve, with points inside, on and outside the frontier and shifts for growth.
Included in the school licence.
Teaching notes
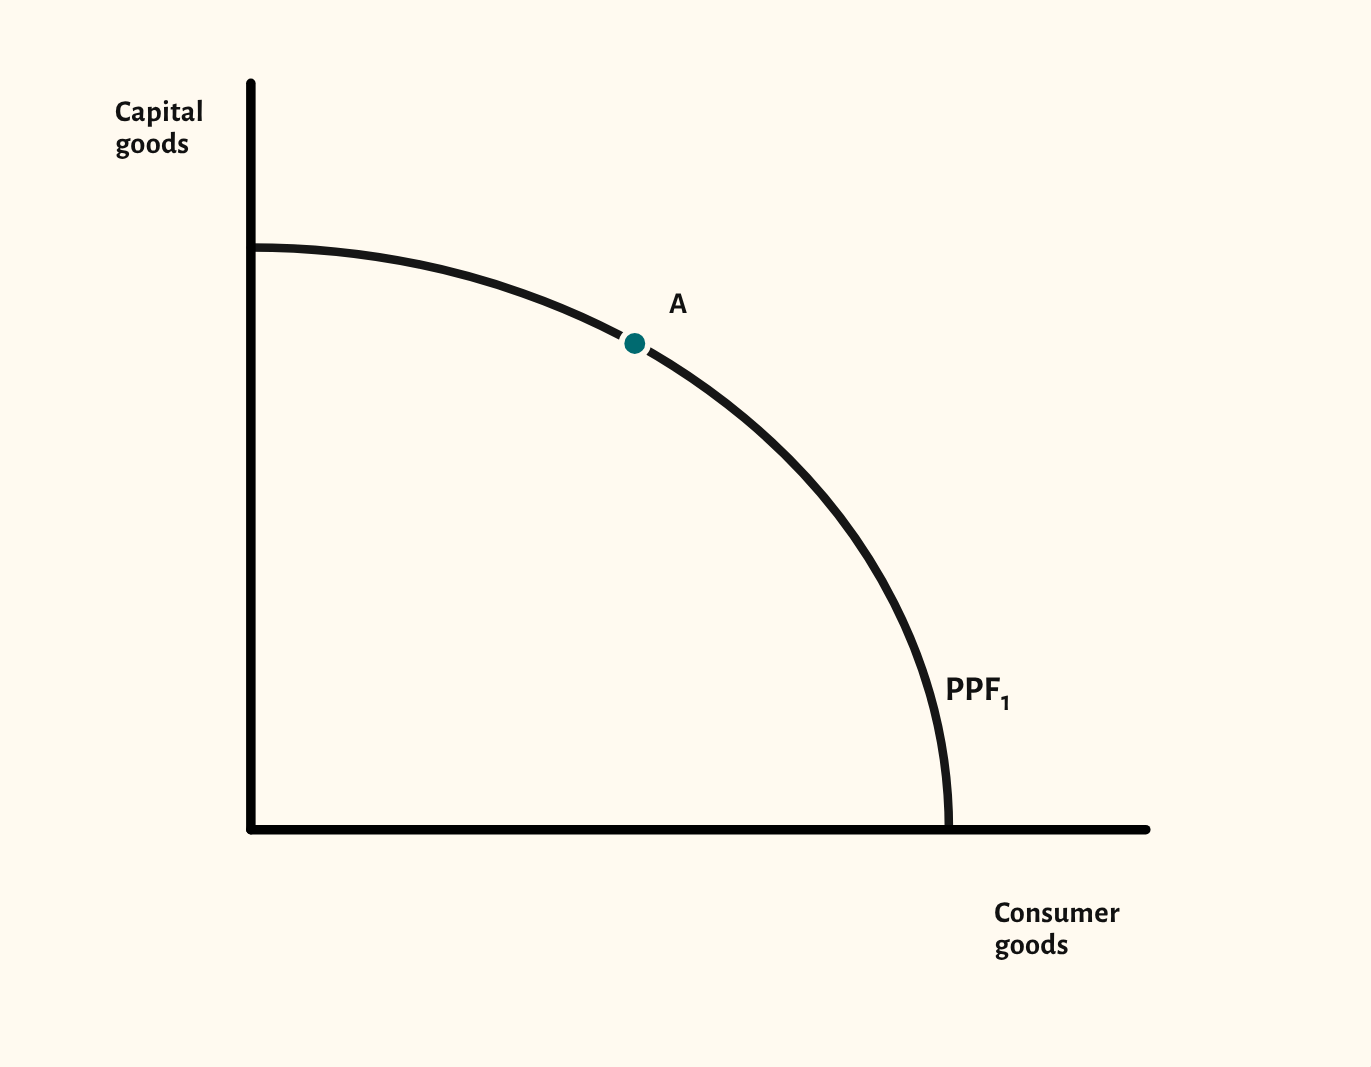
The production possibility frontier is usually the first diagram an A-level Economics class meets, and it carries the course's first big ideas: scarcity, choice and opportunity cost. The starting point shows a bowed-out frontier between capital goods and consumer goods, with point A on it.
The scenarios cover the points examiners ask about: a point inside the frontier for unemployed resources, an unattainable point outside it, and a move along the frontier to show opportunity cost. Then shift the whole frontier outwards for economic growth, inwards after a loss of resources, or pivot it for growth in one good only.
Edexcel, Eduqas, WJEC and Edexcel International call it a frontier (PPF); OCR, AQA and Cambridge call it a curve (PPC). Pick your exam board and the diagram uses your specification's word.
In a lesson, try asking the class what the economy gives up to move from one point to another before you step through the opportunity cost scenario. The capital and consumer goods axes also set up a later discussion of why investment today means more growth tomorrow.
What you can show
Each of these is one click in the diagram's Scenarios menu, and each starts from the plain diagram.
- Unemployed resources – a point inside
- Unattainable – a point outside
- Opportunity cost – moving along the PPF
- Economic growth – outward shift
- Inward shift
- Growth in one good only
Exam boards
On the Edexcel A, AQA, OCR, Eduqas, WJEC, Cambridge International and Edexcel International A-level specifications, drawn in exam style: black lines, clear labels and no grid.