
Development models: Harrod–Domar and Lewis
Two models of economic development: how savings and investment drive growth in the Harrod–Domar model, and how reinvested profits draw surplus labour into industry in the Lewis model.
Included in the school licence.
Teaching notes
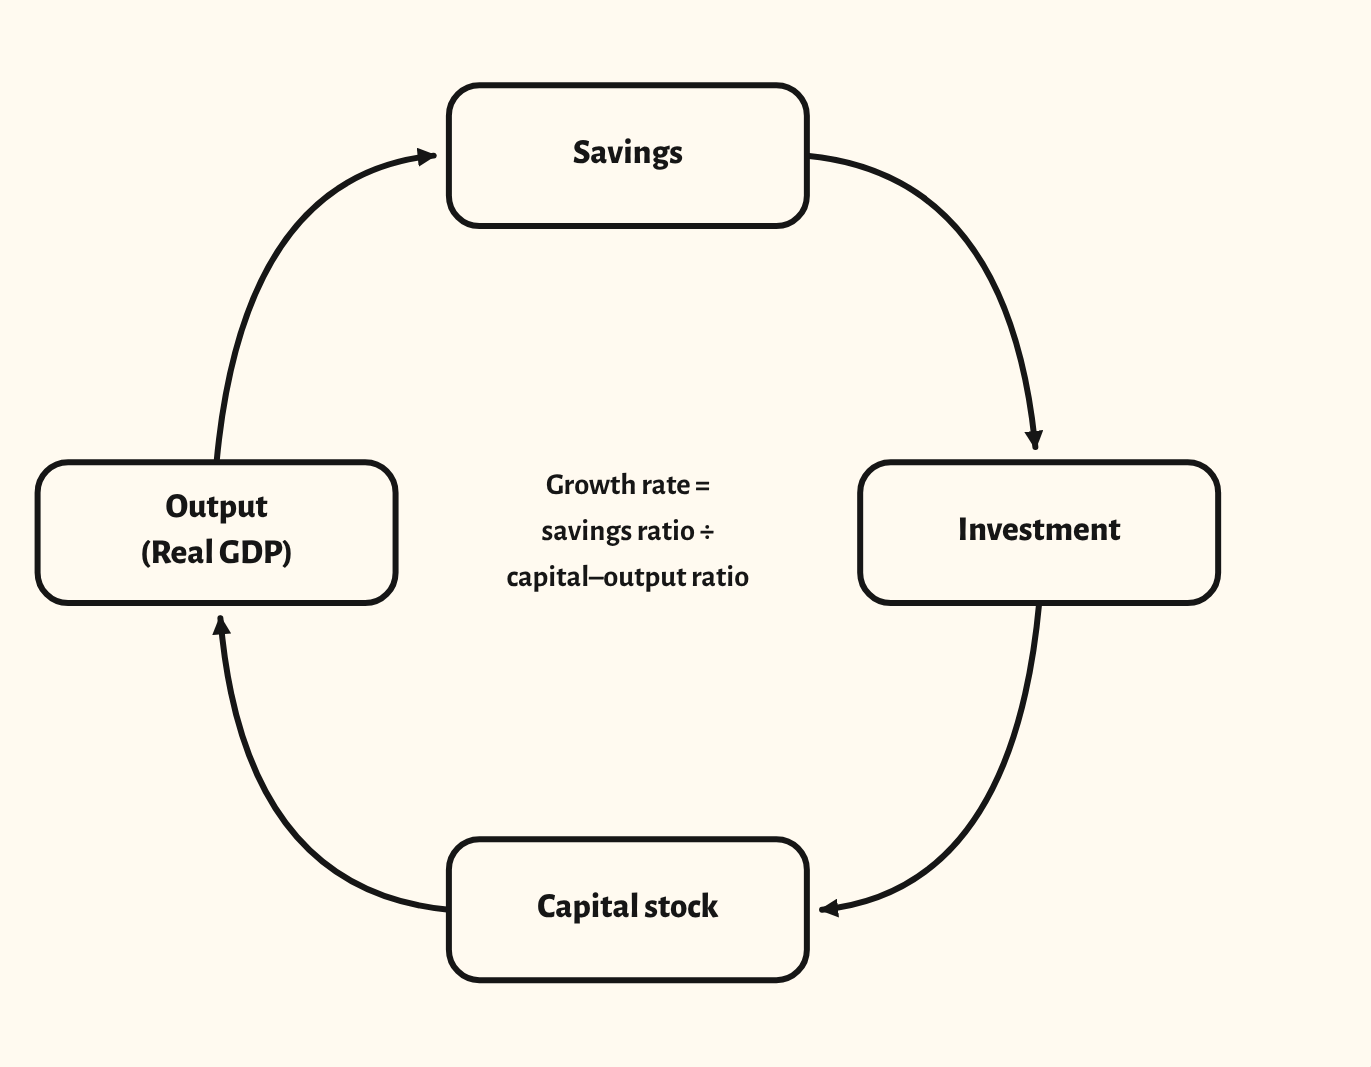
The Harrod–Domar model is drawn as a loop: savings fund investment, investment adds to the capital stock, more capital raises output (Real GDP), and higher output brings more savings. In the middle, the growth rate equals the savings ratio divided by the capital–output ratio. A change shows as an up or down arrow beside each name, and an extra box shows aid, FDI and remittances filling the savings gap.
The Lewis model shows the labour market in the industrial sector. Surplus labour from the traditional sector is available at a constant wage, so the supply of labour is flat until the Lewis turning point. Each round of reinvested profits shifts the marginal product of labour, MPL, to the right, drawing in more workers, with profits and wages shaded on the diagram.
In a lesson, try asking the class why a low savings ratio traps a country in slow growth, and whether aid can break the loop. With the Lewis model, ask what happens to wages once surplus labour runs out, and why that matters for the people who move to the cities.
What you can show
Each of these is one click in the diagram's Scenarios menu, and each starts from the plain diagram.
- The savings ratio rises
- Capital becomes more productive
- Aid and FDI fill the savings gap
- Reinvested profits draw in surplus labour
- Past the Lewis turning point, wages rise
Exam boards
On the Edexcel A, OCR and Edexcel International A-level specifications, drawn in exam style: black lines, clear labels and no grid.