
Money market diagram
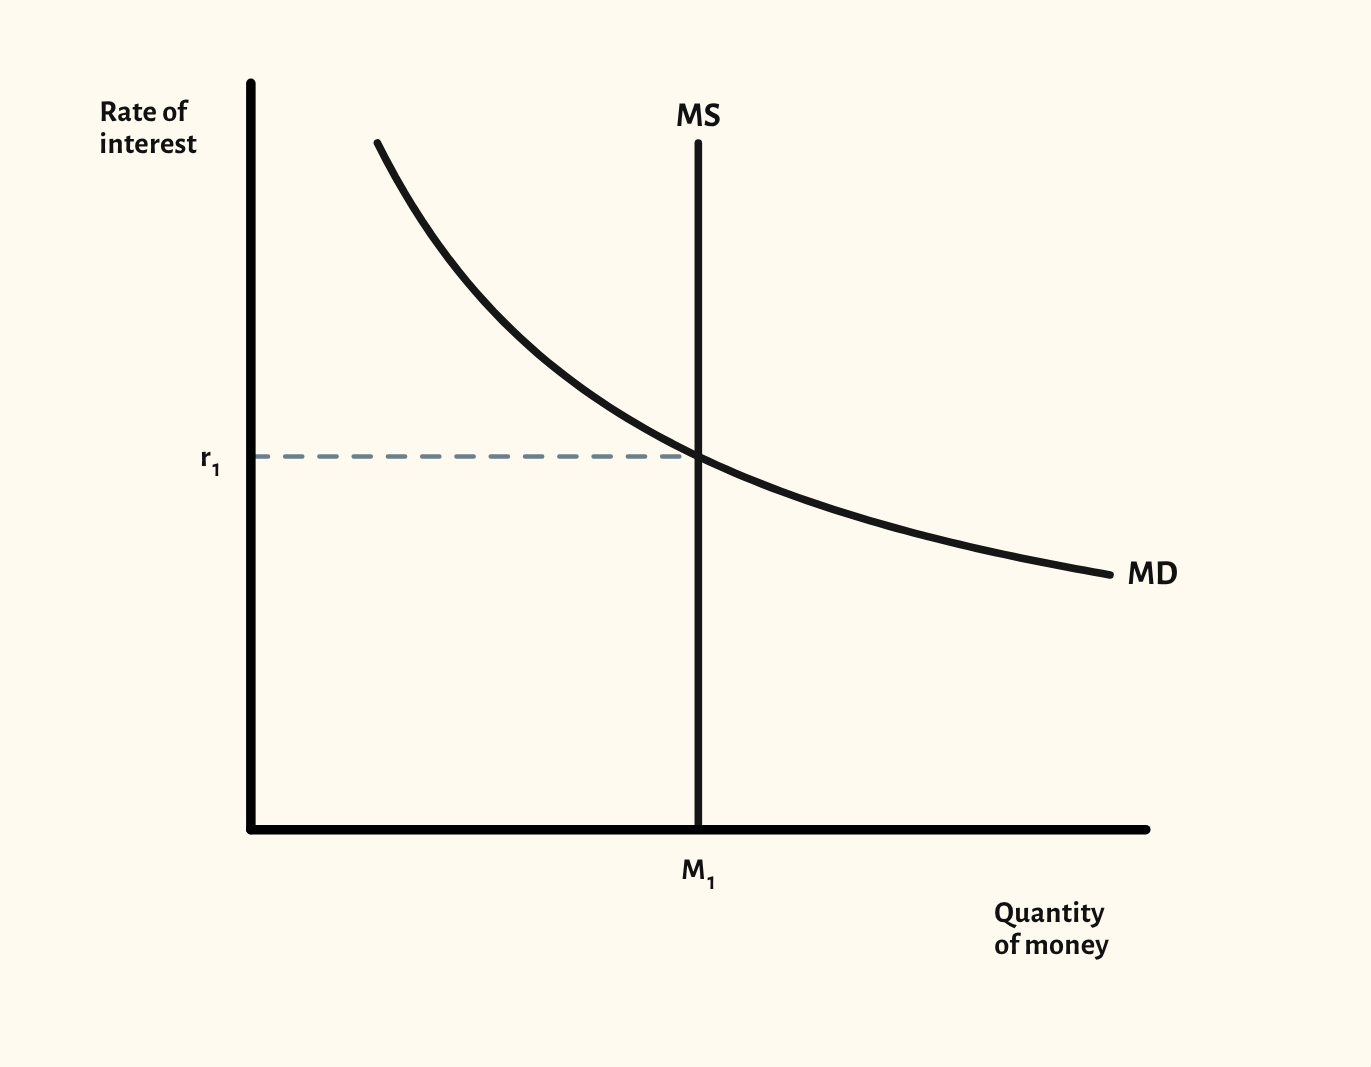
How the rate of interest is set, by the demand for and supply of money, and by saving and investment in the loanable funds market.
Included in the school licence.
Teaching notes
The money market diagram shows how the rate of interest is set. The starting point uses liquidity preference: a vertical money supply curve, MS, meets the downward-sloping demand for money, MD, at the rate of interest r1.
The scenarios show the central bank increasing the money supply and a rise in the demand for money, then switch to the loanable funds model, where more saving or more investment by firms changes the rate of interest.
In a lesson, try asking the class why the money supply curve is drawn vertical. Then compare the two models and ask which one better explains a central bank's decision to raise interest rates.
What you can show
Each of these is one click in the diagram's Scenarios menu, and each starts from the plain diagram.
- The central bank increases the money supply
- Demand for money rises
- Saving rises
- Firms want to invest more
Exam boards
On the OCR and Cambridge International A-level specifications, drawn in exam style: black lines, clear labels and no grid.