
Consumer choice: marginal utility and indifference curves
How a consumer chooses: diminishing marginal utility and the demand curve, then indifference curves, budget lines and the income and substitution effects of a price change.
Included in the school licence.
Teaching notes
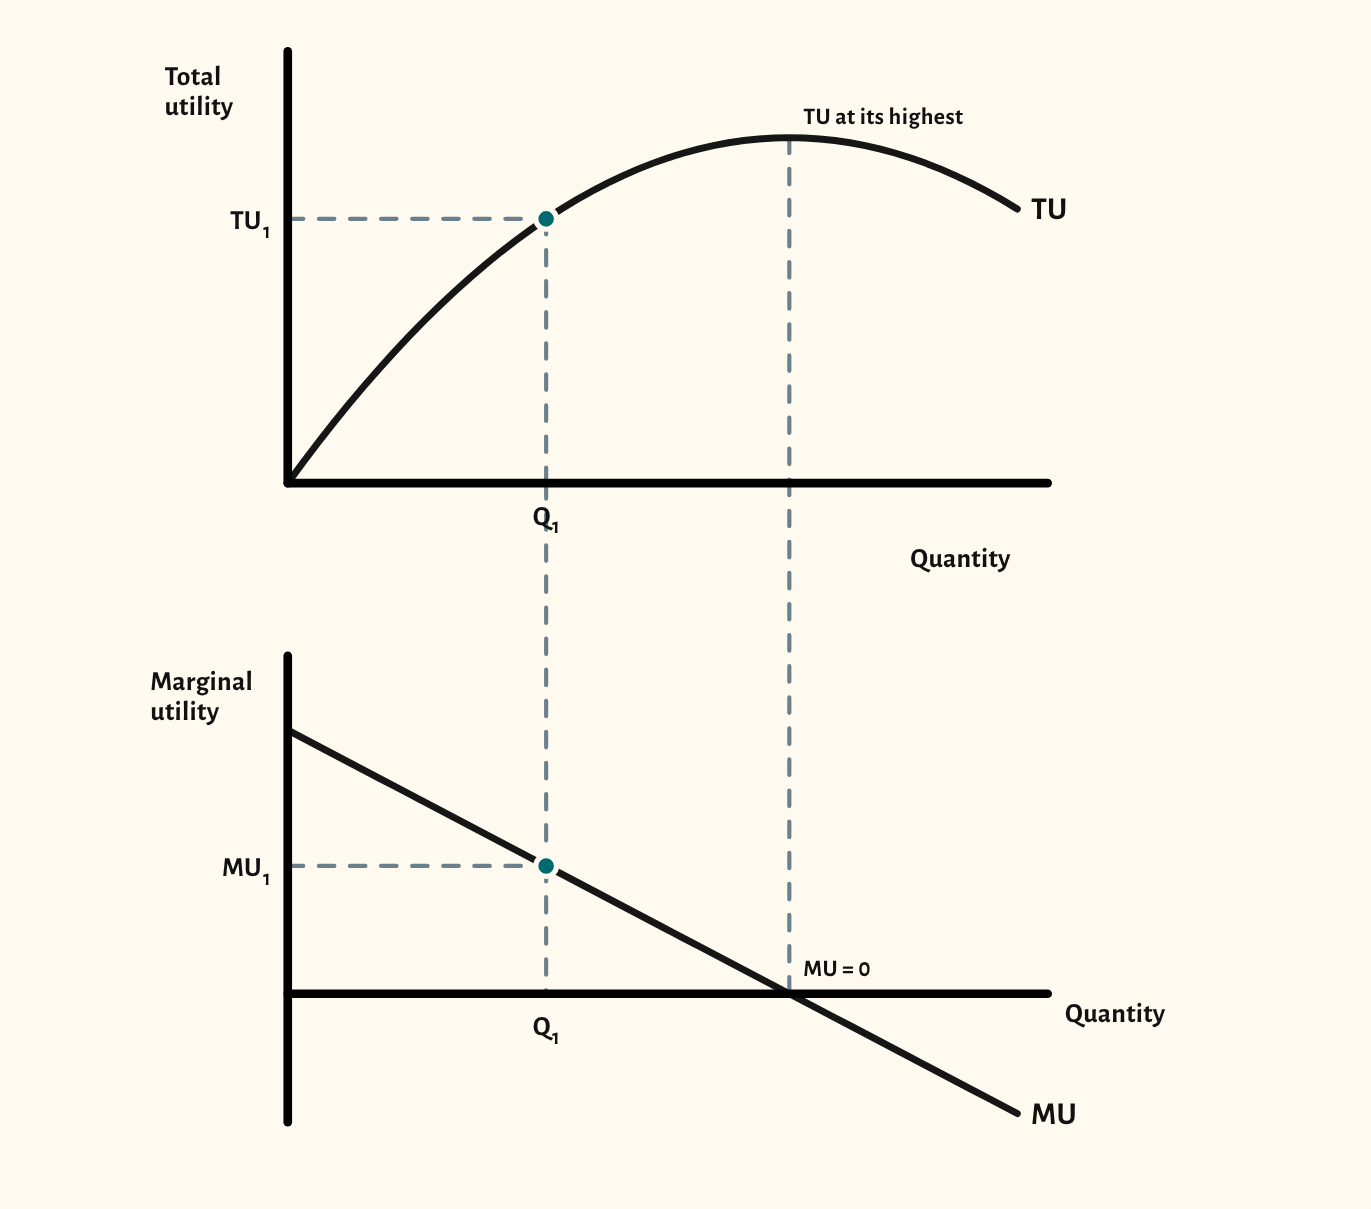
The starting point draws total utility above marginal utility. Total utility rises more and more slowly, so marginal utility falls, and where total utility is at its highest, marginal utility is zero. A second view sets marginal utility above the demand curve: the consumer buys until marginal utility equals the price, so a lower price means a larger quantity. A third view shows the equi-marginal principle, with marginal utility per pound for two goods side by side.
For Cambridge International, the indifference curve views draw a budget line and an indifference map, shift the budget line for a change in income or in the price of X, and split a price change into its substitution and income effects for a normal, an inferior and a Giffen good. Arrows under the axis show each effect, and the demand curve can be derived underneath.
In a lesson, try asking the class why the third slice of pizza is worth less than the first, and what that means for the price they would pay. With indifference curves, ask why a Giffen good is so rare, and what the income effect has to do with it.
What you can show
Each of these is one click in the diagram's Scenarios menu, and each starts from the plain diagram.
- Diminishing marginal utility
- Marginal utility and the demand curve
- Equi-marginal principle – the price of X falls
- Rise in income
- Fall in the price of X
- Price fall – normal good
- Price rise – normal good
- Price fall – inferior good
- Price fall – Giffen good
- Demand curve from indifference curves
Exam boards
On the Edexcel A, AQA, OCR, Eduqas, WJEC, Cambridge International and Edexcel International A-level specifications, drawn in exam style: black lines, clear labels and no grid.