
Buffer stock diagram
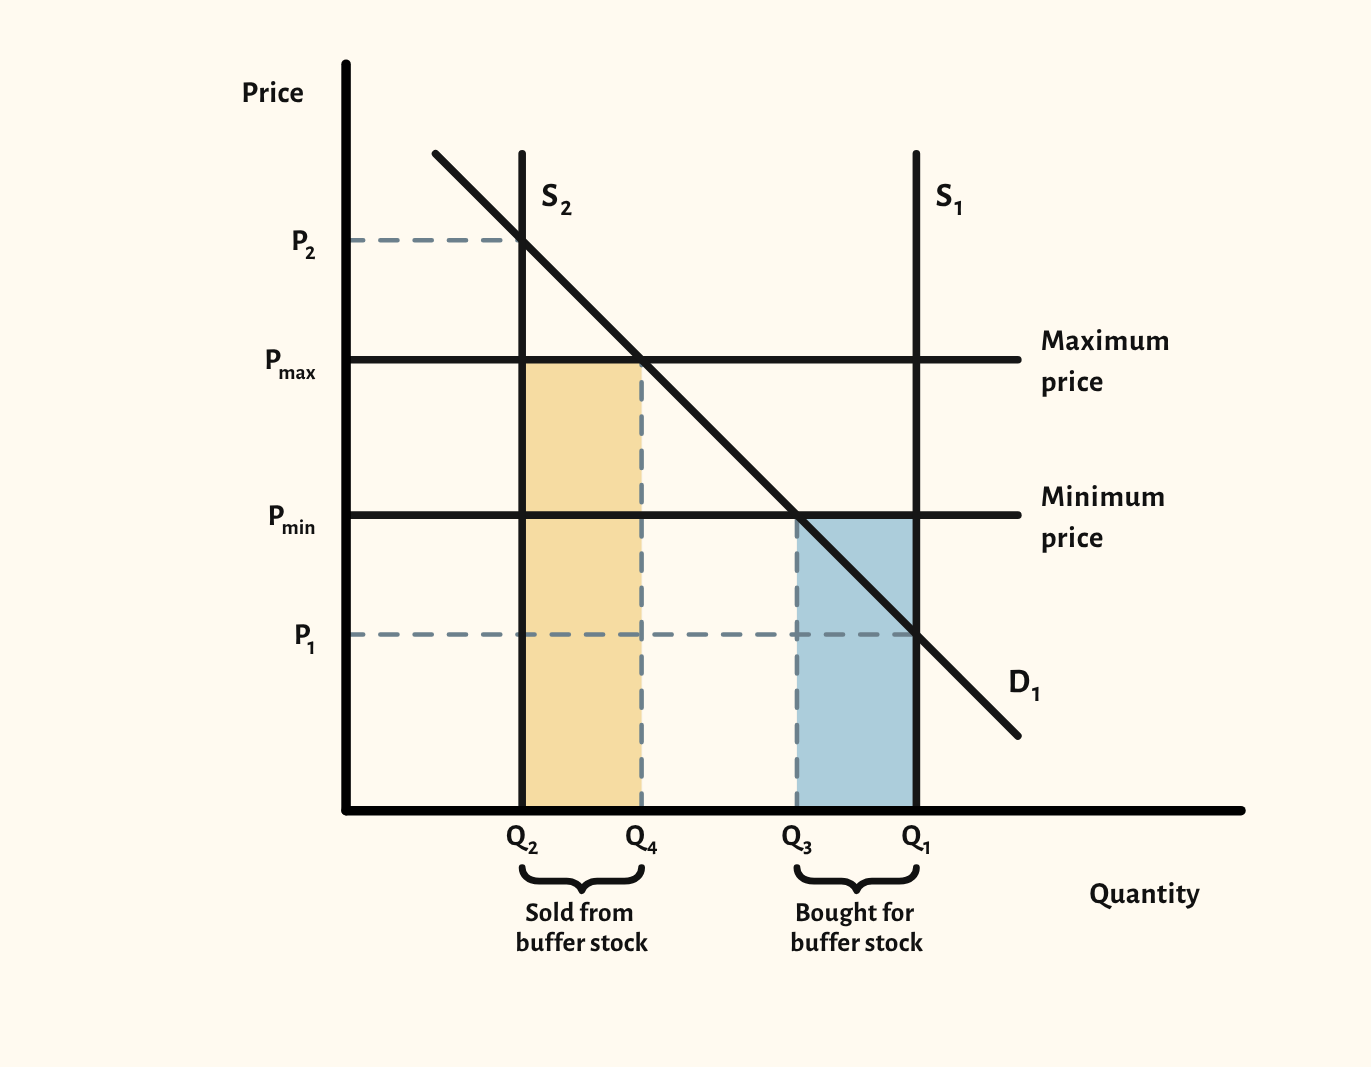
A buffer stock scheme that keeps a commodity price between a minimum and a maximum by buying in good harvests and selling in poor ones.
Open this scenario in CueCurve
Included in the school licence.
What the diagram shows
Agricultural supply swings with the weather, so prices and farm incomes are unstable. A buffer stock scheme sets a price band, a minimum and a maximum, and uses a stock of the commodity to keep the price inside it. Supply is drawn vertical because the harvest is fixed once it is in.
After a good harvest (S1), the price would fall below the minimum, so the agency buys the surplus and adds it to the stock. After a poor harvest (S2), the price would rise above the maximum, so the agency sells from the stock. The evaluation is about cost and storage: a run of good harvests fills the warehouses, and a minimum price set too high means the agency keeps buying.
Drawing it in an exam
- Draw the minimum and maximum prices as horizontal lines and label them.
- Use vertical supply curves for the good and poor harvests, and mark the free-market price each would give.
- Mark the quantity bought for the stock at the minimum price, and the quantity sold from it at the maximum price.
- Say where the money and the stock come from, since the scheme only works if purchases and sales roughly balance over time.
Your exam board
Choose your board to see where this sits in its specification and what its mark schemes look for.
Edexcel A
- Specification
- We haven't recorded the exact specification point for this board yet.
- What its mark schemes look for
- Examiners keep asking for diagrams that are accurately drawn, fully labelled and used in the answer, and a top-level essay often needs an accurate diagram.
Edexcel B
- Specification
- We haven't recorded the exact specification point for this board yet.
- What its mark schemes look for
- A diagram on its own earns at most 4 of 6 marks: the answer has to explain it. Diagrams should be fully labelled, with the original equilibrium shown.
AQA
- Specification
- We haven't recorded the exact specification point for this board yet.
- What its mark schemes look for
- Short Draw questions are marked by counting labels: both axes, every curve, and the prices and quantities. No title or grid lines are needed.
OCR
- Specification
- We haven't recorded the exact specification point for this board yet.
- What its mark schemes look for
- Diagram marks are listed point by point: axes labelled, curves labelled with the right shift, and the old and new equilibrium marked.
Eduqas
- Specification
- We haven't recorded the exact specification point for this board yet.
- What its mark schemes look for
- The top bands reward a diagram that is accurate, well labelled and referred to in the writing. A diagram that isn't used drops a band.
WJEC
- Specification
- We haven't recorded the exact specification point for this board yet.
- What its mark schemes look for
- Axes must be labelled for the market in the question, and a question that asks for 'diagrams' expects more than one.
Cambridge International
- Specification
- 3.2 Indirect taxes, subsidies, maximum and minimum prices, and buffer stocks.
- What its mark schemes look for
- The shape needn't be exact, but slopes must go the right way, curves that should meet must meet, and every curve and axis needs a label.
Edexcel International
- Specification
- We haven't recorded the exact specification point for this board yet.
- What its mark schemes look for
- Draw questions give a mark for labelled axes and the original curves, then marks for the change and the new price and quantity. The diagram alone can earn every mark.
Paraphrased from published specifications, mark schemes and examiner reports. How we check
In CueCurve you can also
- Build the diagram line by line in front of the class with Step by step, so they see the order to draw it in.
- Drag the curves live and switch scenarios in one click, starting from the plain diagram each time.
- Present it full screen, draw on it with the pen, and save it into a lesson.