
Tradable pollution permits diagram
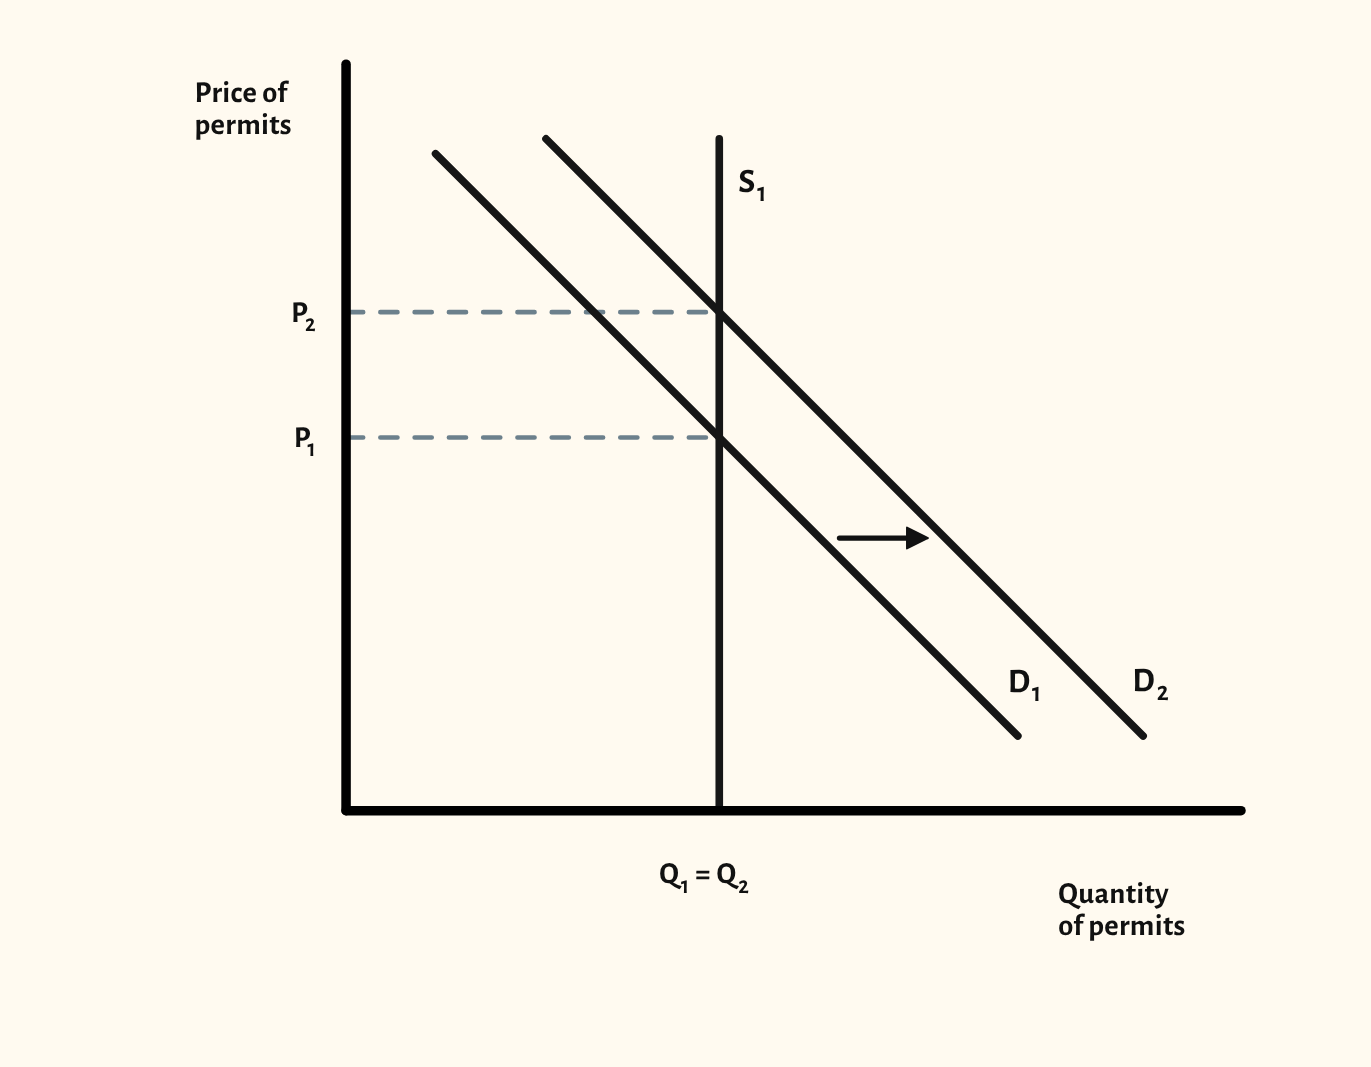
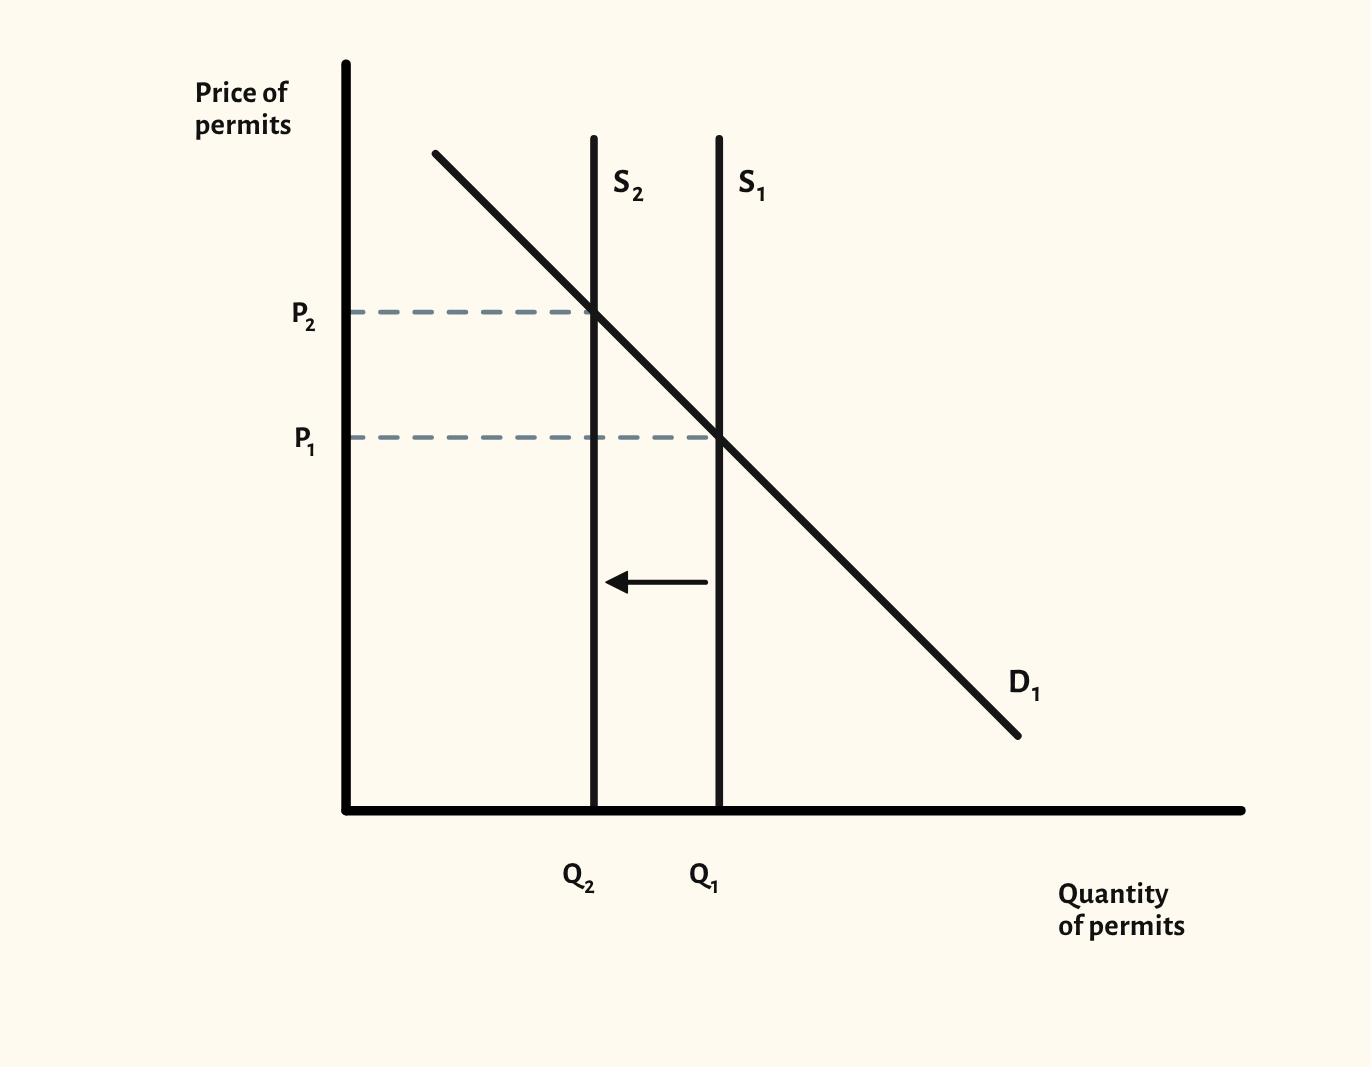
A market for tradable pollution permits, with a perfectly inelastic supply set by the cap, a rise in demand, and a cut in the number of permits.
Open this scenario in CueCurve
Included in the school licence.
What the diagram shows
A permit scheme caps the total amount of pollution and lets firms buy and sell the right to pollute. Supply of permits is set by the regulator, so it is perfectly inelastic: a vertical line at the cap.
If demand for permits rises, for example because the economy grows, only the price changes, and firms that can cut pollution cheaply have more reason to sell. If the regulator cuts the cap, supply shifts left and the price rises, which pushes firms to invest in cleaner methods. The total pollution is set by the cap, and the market decides which firms do the cutting.
One more scenario
Drawing it in an exam
- Label the axes price of permits and quantity of permits.
- Draw the supply of permits as a vertical line, because the number is fixed by the cap; an upward-sloping supply loses marks.
- Show a cut in the number of permits as the vertical line shifting left, and mark the old and new prices.
- Link the price of permits to the incentive to cut pollution in the writing.
Your exam board
Choose your board to see where this sits in its specification and what its mark schemes look for.
Edexcel A
- Specification
- We haven't recorded the exact specification point for this board yet.
- What its mark schemes look for
- Supply of permits drawn perfectly inelastic, with a cut in the number shifting it left.
Edexcel B
- Specification
- We haven't recorded the exact specification point for this board yet.
- What its mark schemes look for
- A diagram on its own earns at most 4 of 6 marks: the answer has to explain it. Diagrams should be fully labelled, with the original equilibrium shown.
AQA
- Specification
- We haven't recorded the exact specification point for this board yet.
- What its mark schemes look for
- Short Draw questions are marked by counting labels: both axes, every curve, and the prices and quantities. No title or grid lines are needed.
OCR
- Specification
- We haven't recorded the exact specification point for this board yet.
- What its mark schemes look for
- Diagram marks are listed point by point: axes labelled, curves labelled with the right shift, and the old and new equilibrium marked.
Eduqas
- Specification
- Why and how governments intervene in markets: tradable pollution permits and road pricing.
- What its mark schemes look for
- Supply of permits must be perfectly inelastic; an upward-sloping supply loses a mark.
WJEC
- Specification
- AS, Why and how governments intervene in markets: tradable pollution permits and road pricing.
- What its mark schemes look for
- Axes must be labelled for the market in the question, and a question that asks for 'diagrams' expects more than one.
Cambridge International
- Specification
- 8.1.1 Pollution permits.
- What its mark schemes look for
- The shape needn't be exact, but slopes must go the right way, curves that should meet must meet, and every curve and axis needs a label.
Edexcel International
- Specification
- 1.3.6 Tradable pollution permits.
- What its mark schemes look for
- Supply of permits drawn perfectly inelastic, with a cut in the number shifting it left.
With a school licence, the How often page in CueCurve lists the exam questions each board has asked that call for this diagram.
Paraphrased from published specifications, mark schemes and examiner reports. How we check
In CueCurve you can also
- Build the diagram line by line in front of the class with Step by step, so they see the order to draw it in.
- Drag the curves live and switch scenarios in one click, starting from the plain diagram each time.
- Present it full screen, draw on it with the pen, and save it into a lesson.