
Negative externality diagram
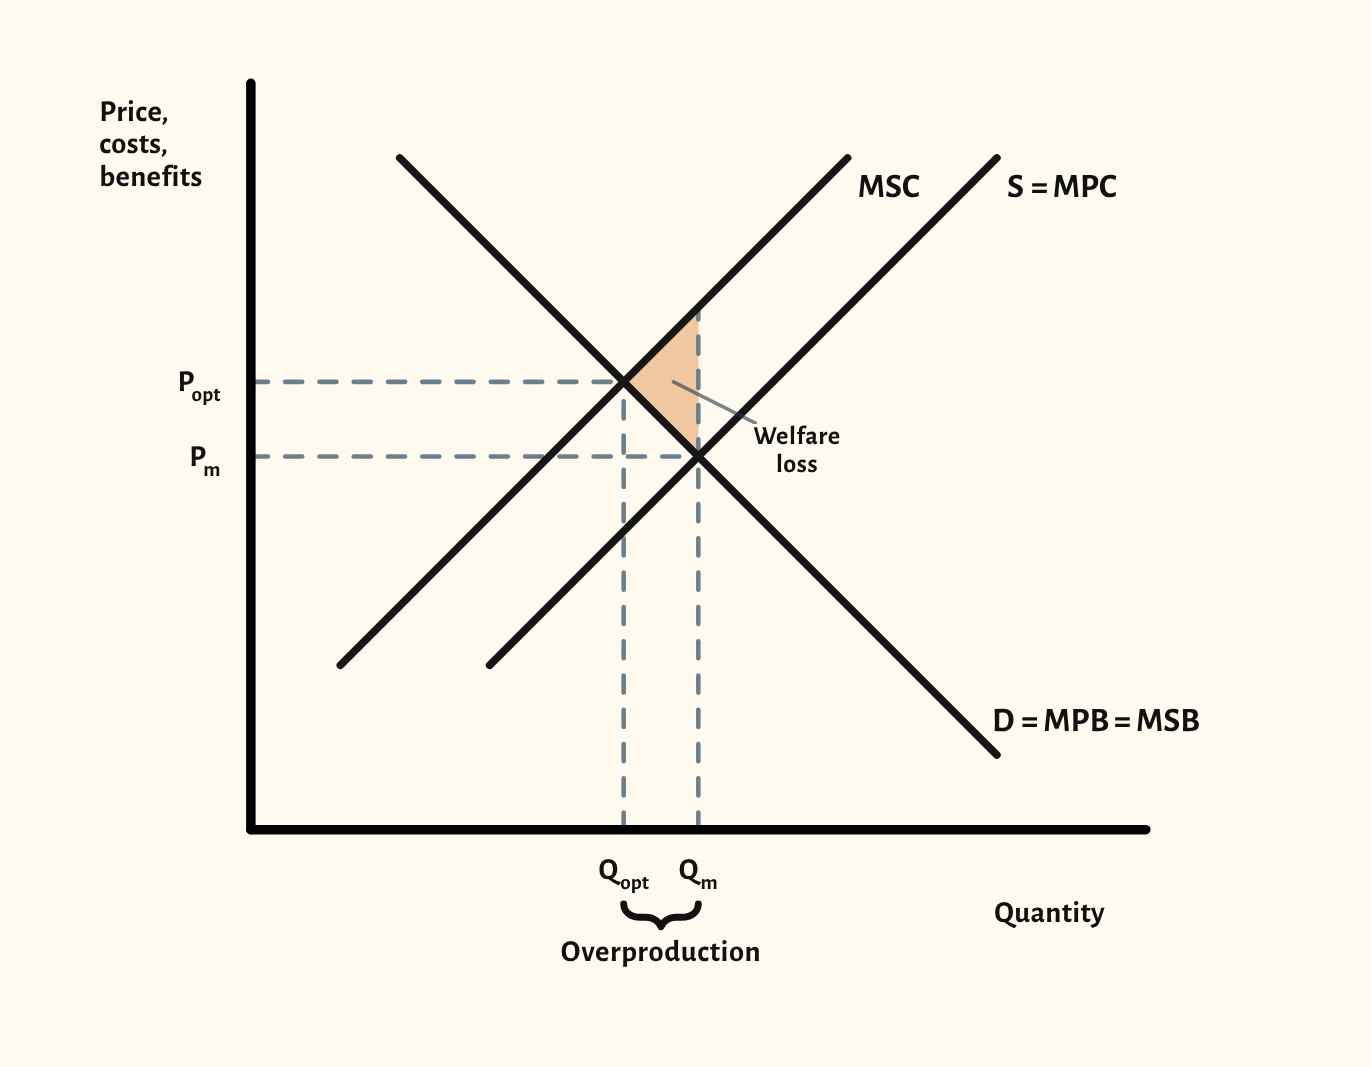
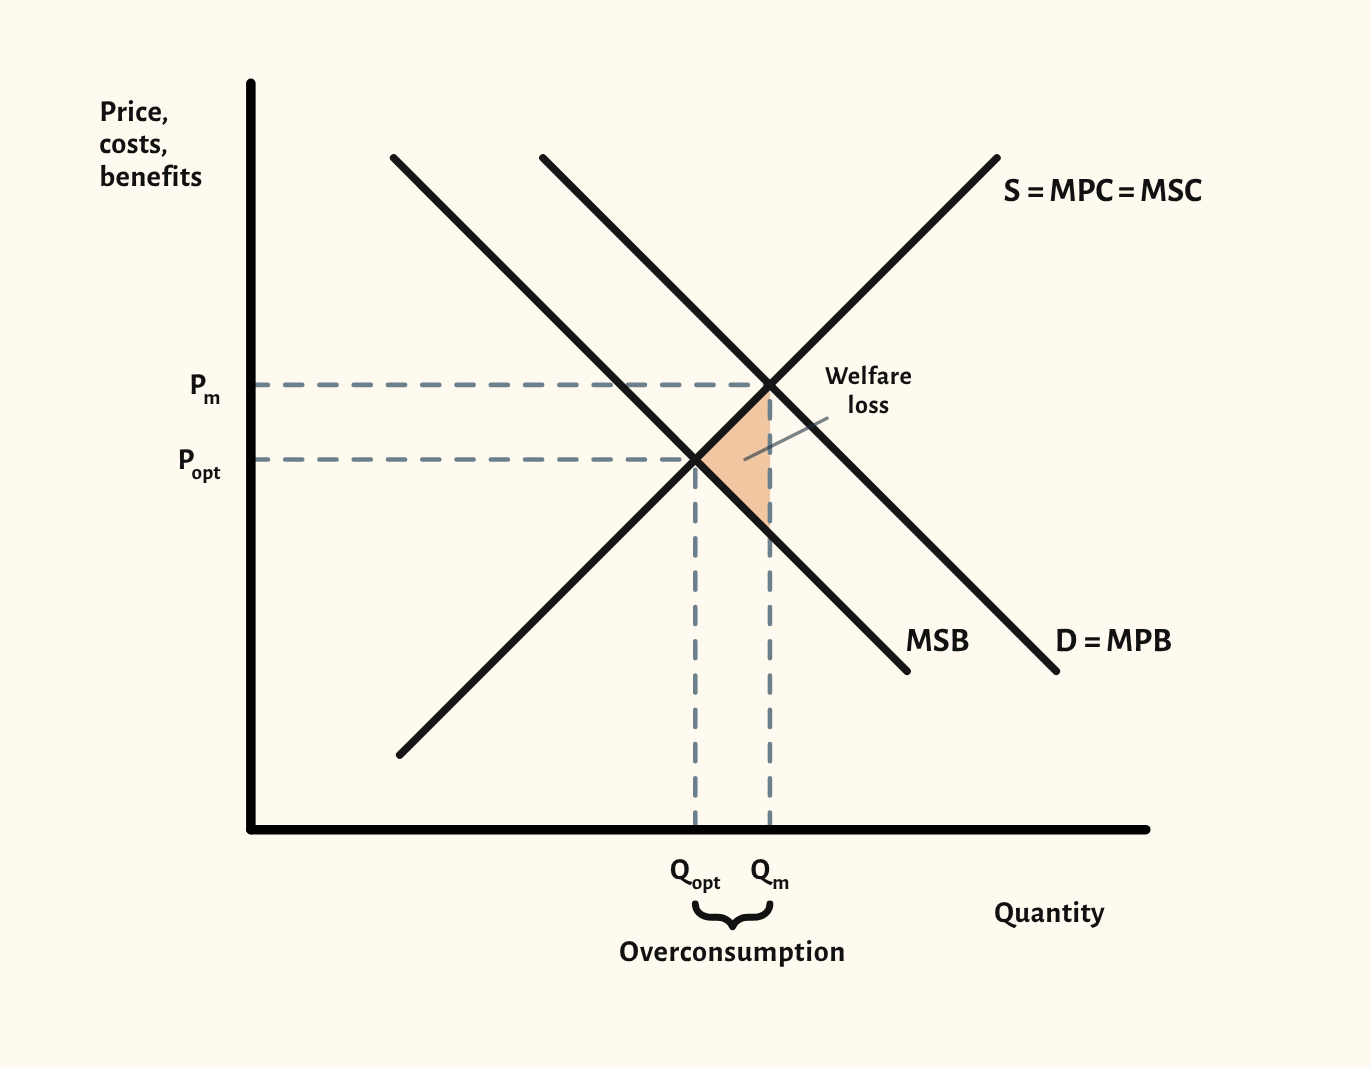
Negative production and consumption externalities, drawn the way examiners expect: private and social curves apart, the market and optimum outputs marked, and the welfare loss shaded.
Open this scenario in CueCurve
Included in the school licence.
What the diagram shows
With a negative production externality, firms don't pay the full cost of what they make, so marginal social cost (MSC) sits above marginal private cost (S = MPC). The market settles where MPC meets demand, at Qm and Pm. The social optimum is where MSC meets marginal social benefit, at the lower Qopt and the higher Popt. The gap from Qopt to Qm is overproduction, and the triangle between MSC and MSB over that gap is the welfare loss.
A negative consumption externality is the same idea on the benefit side: marginal social benefit (MSB) sits below marginal private benefit (D = MPB), and the market overconsumes.
Two scenarios
Drawing it in an exam
- Keep the private and social curves apart and label both, for example S = MPC and MSC. A parallel gap or a widening gap is accepted.
- Mark both outputs on the axis, the market Qm and the optimum Qopt, and both prices.
- Shade or letter the welfare loss: the triangle between the social curves from Qopt to Qm, with its point at the optimum.
- A common slip is shading the triangle on the wrong side of the optimum, or drawing MSC below MPC for a negative externality.
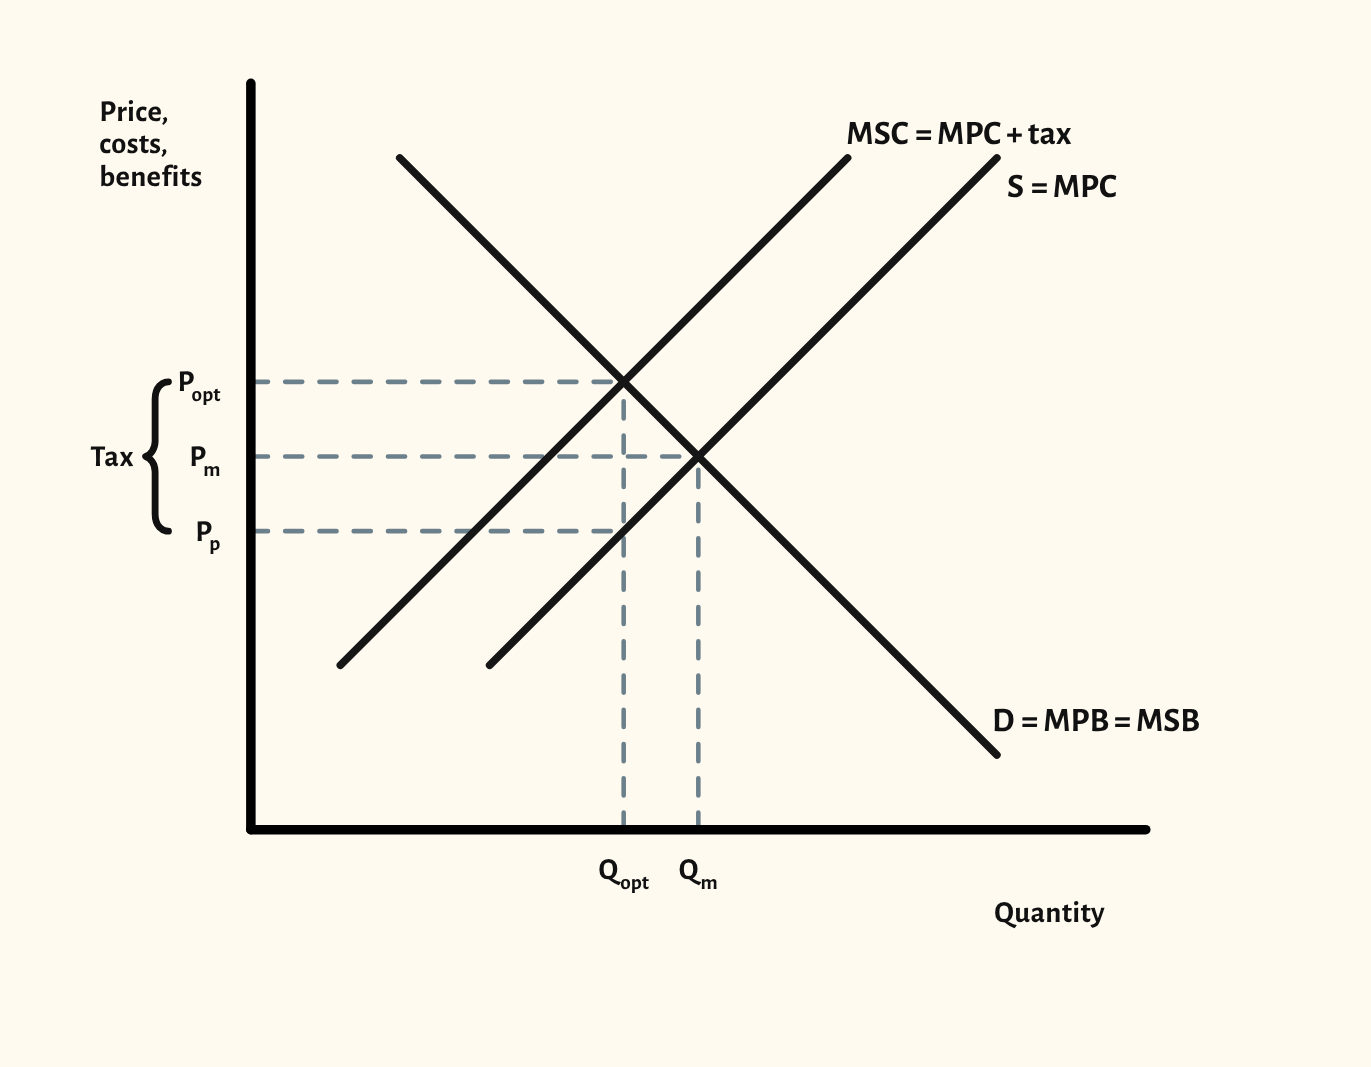
- For a corrective tax, show it as the vertical distance between MPC and MSC, equal to the marginal external cost.
Your exam board
Choose your board to see where this sits in its specification and what its mark schemes look for.
Edexcel A
- Specification
- 1.3.2 External costs of production and external benefits of consumption.
- What its mark schemes look for
- One mark for the private and social curves drawn apart and one for the equilibrium or the welfare loss.
Edexcel B
- Specification
- We haven't recorded the exact specification point for this board yet.
- What its mark schemes look for
- A diagram on its own earns at most 4 of 6 marks: the answer has to explain it. Diagrams should be fully labelled, with the original equilibrium shown.
AQA
- Specification
- 4.1.8.4 Production and consumption externalities.
- What its mark schemes look for
- Short Draw questions are marked by counting labels: both axes, every curve, and the prices and quantities. No title or grid lines are needed.
OCR
- Specification
- 2c.2.8–2.9 Positive and negative consumption and production externalities.
- What its mark schemes look for
- For a corrective tax, MSC drawn above supply as MPC + tax, with the tax shown as a vertical distance. Micro diagrams use price and quantity on the axes; marks are lost for macro labels such as 'price level'.
Eduqas
- Specification
- Understanding market failure: external costs and benefits, with the welfare loss.
- What its mark schemes look for
- The top bands reward a diagram that is accurate, well labelled and referred to in the writing. A diagram that isn't used drops a band.
WJEC
- Specification
- AS, Understanding market failure: external costs and benefits, with the welfare loss.
- What its mark schemes look for
- Axes must be labelled for the market in the question, and a question that asks for 'diagrams' expects more than one.
Cambridge International
- Specification
- 7.4 Positive and negative externalities of consumption and production, with deadweight welfare losses.
- What its mark schemes look for
- The axes are private and social costs and benefits, not just price and quantity.
Edexcel International
- Specification
- 1.3.5 External costs of production and external benefits of consumption, with the welfare areas.
- What its mark schemes look for
- MSC above MPC, the market and optimum quantities and prices, and the welfare loss triangle. An essay with no externality diagram is held at Level 2.
With a school licence, the How often page in CueCurve lists the exam questions each board has asked that call for this diagram.
Paraphrased from published specifications, mark schemes and examiner reports. How we check
In CueCurve you can also
- Build the diagram line by line in front of the class with Step by step, so they see the order to draw it in.
- Drag the curves live and switch scenarios in one click, starting from the plain diagram each time.
- Present it full screen, draw on it with the pen, and save it into a lesson.