
Minimum wage diagram
A minimum wage in a competitive labour market, a rise from one minimum wage to another, and a minimum wage that raises employment under monopsony.
Open this scenario in CueCurve
Included in the school licence.
What the diagram shows
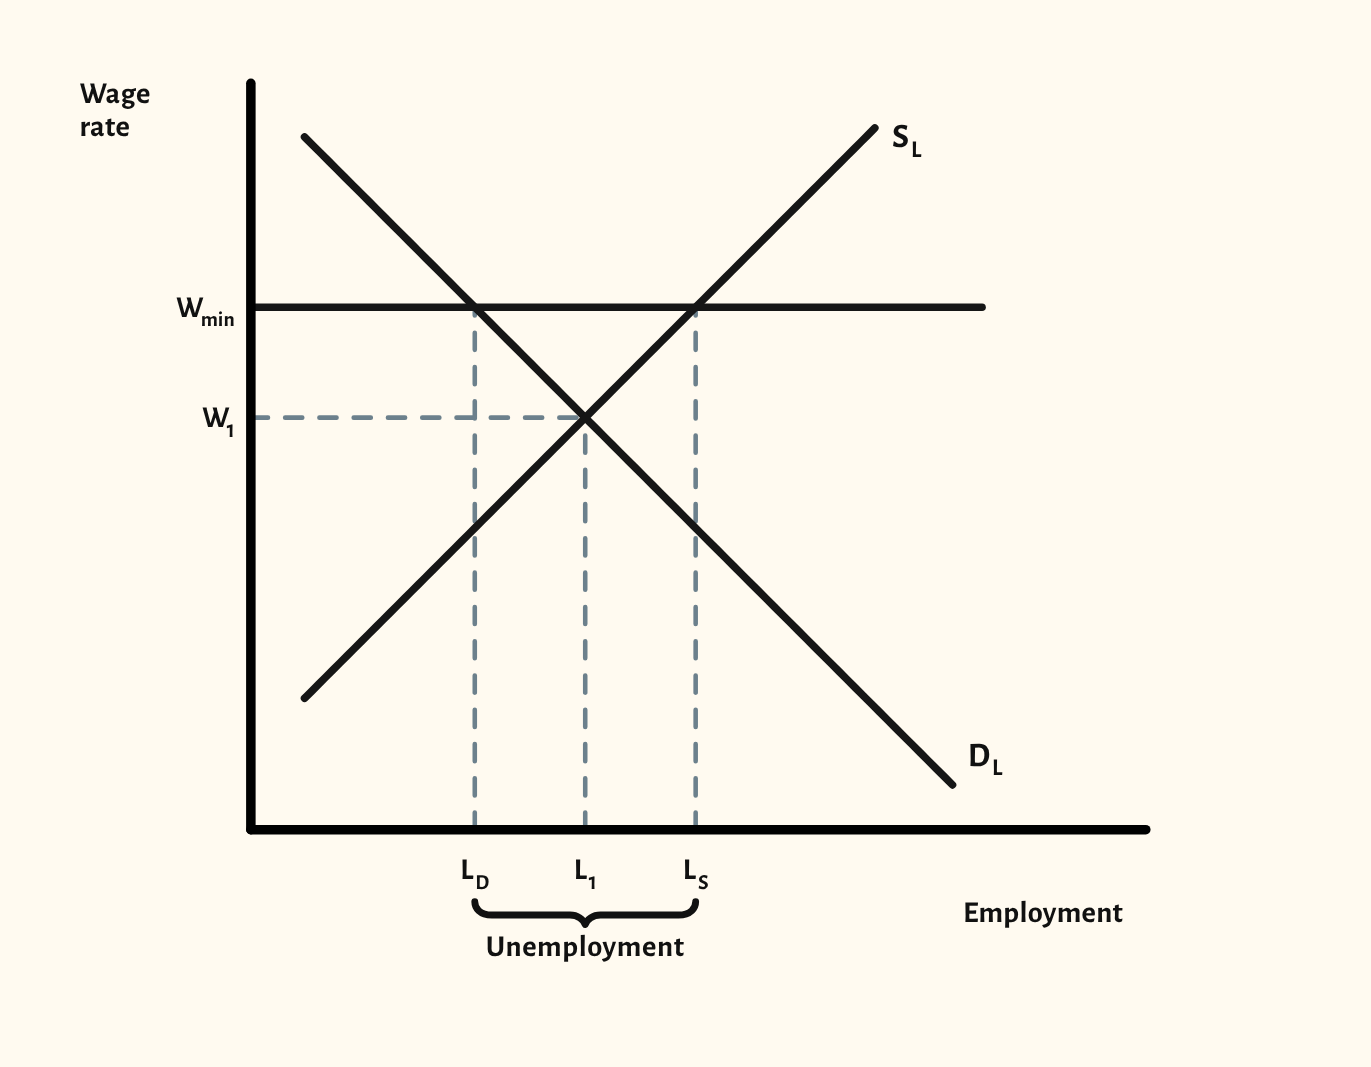
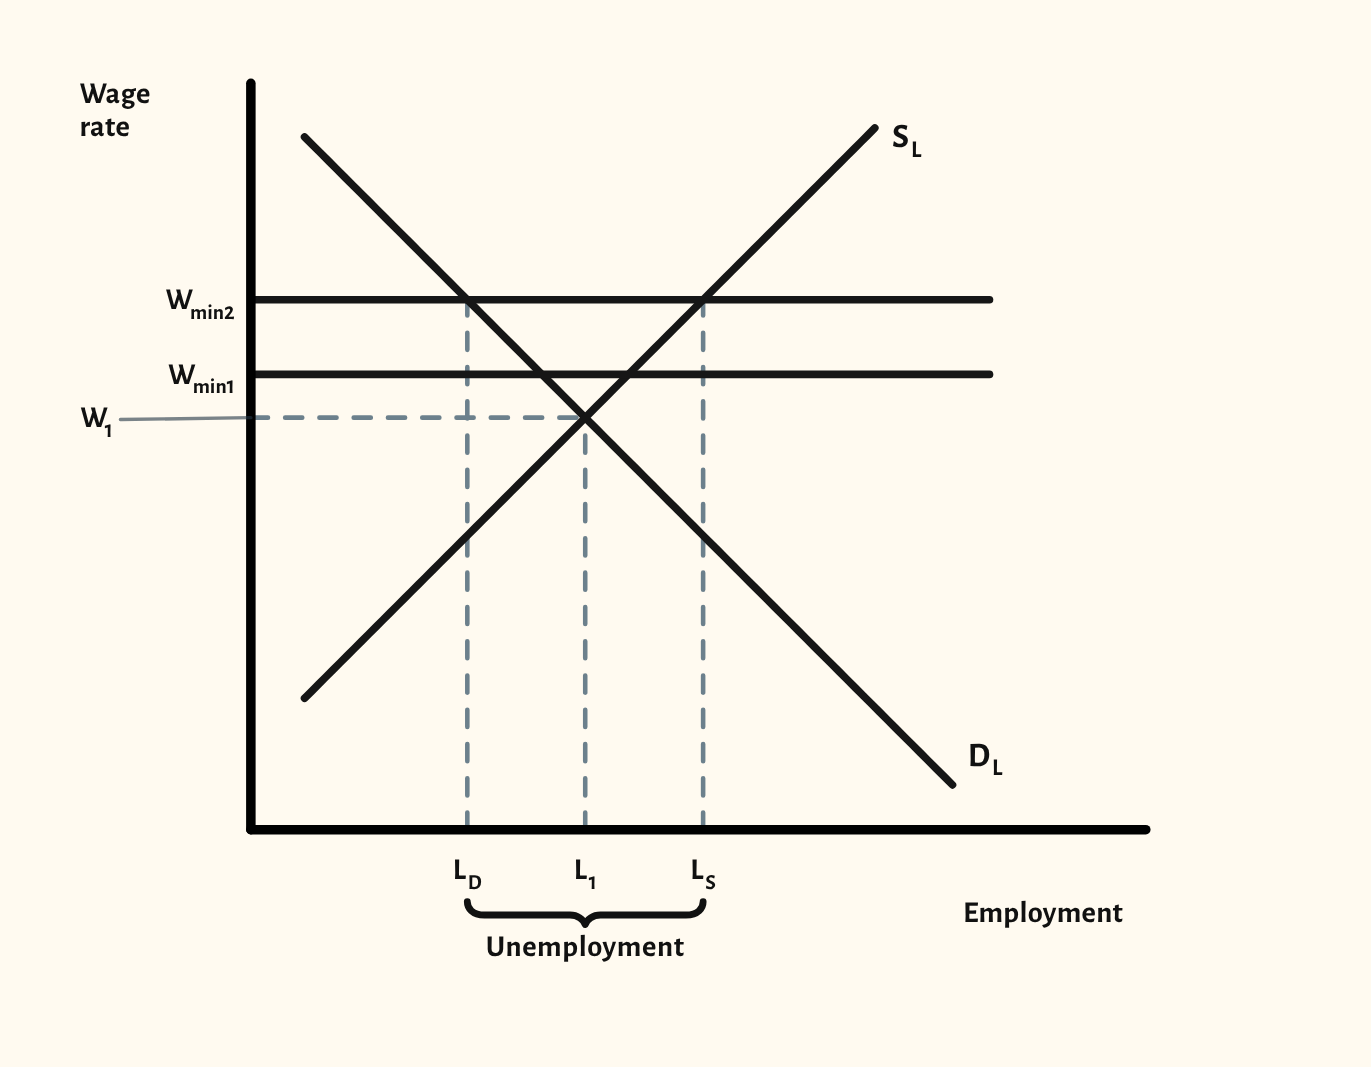
In a competitive labour market, a minimum wage set above the equilibrium wage W1 raises the wage for those in work, but firms demand less labour (LD) and more people want to work (LS). The gap is unemployment, and a rise in the minimum wage widens it.
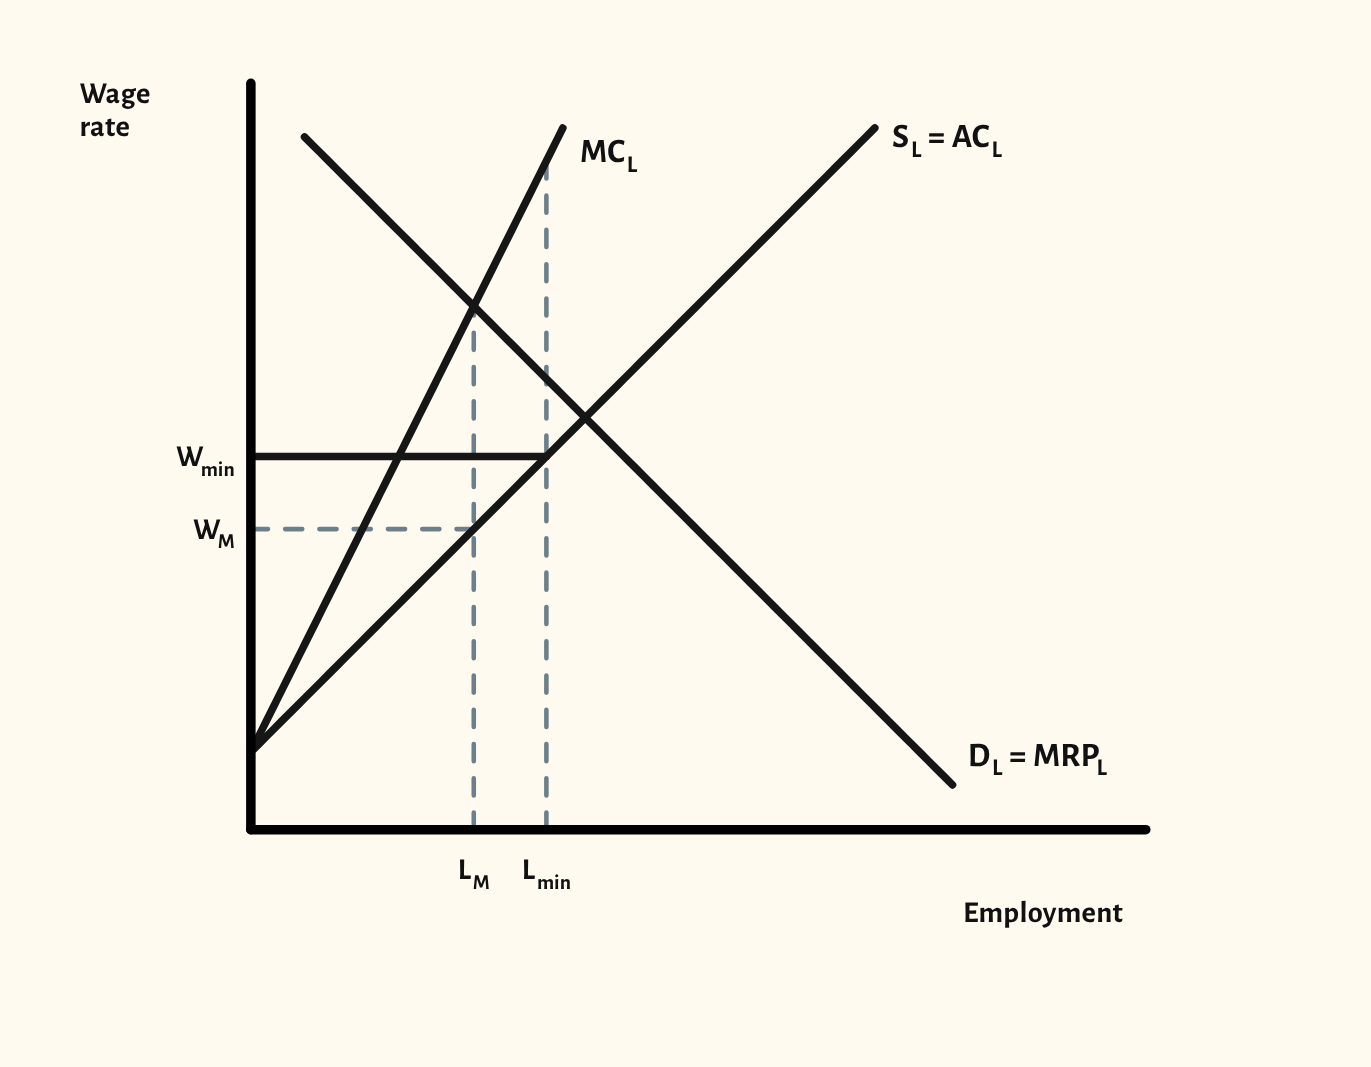
Under monopsony the result can be the opposite. A single large employer pays a wage below the competitive one, WM, and employs fewer people, LM, because hiring one more worker raises the wage for all of them. A minimum wage removes that reason: the marginal cost of labour becomes flat at Wmin up to the supply curve, so the firm employs more, at Lmin, and pays more.
Two scenarios
Drawing it in an exam
- Label the axes wage rate and employment (or quantity of labour), not price and quantity.
- Draw the minimum wage as a horizontal line above equilibrium, and mark LD and LS and the unemployment between them.
- When a question asks about a rise in the minimum wage, show it as a move from one minimum wage to a higher one, not as a new minimum wage.
- For monopsony, show MCL above supply, the monopsony wage and employment, and how the minimum wage makes MCL flat up to the supply curve.
Your exam board
Choose your board to see where this sits in its specification and what its mark schemes look for.
Edexcel A
- Specification
- 3.5.3 The minimum wage.
- What its mark schemes look for
- Marks for axes and curves, the first minimum wage above equilibrium, a higher second one, and the unemployment between the two quantities.
Edexcel B
- Specification
- 3.5 and 4.2.1 The minimum wage.
- What its mark schemes look for
- A diagram on its own earns at most 4 of 6 marks: the answer has to explain it. Diagrams should be fully labelled, with the original equilibrium shown.
AQA
- Specification
- 4.1.6.6 The National Minimum Wage.
- What its mark schemes look for
- With a monopsony, the wage floor makes the marginal cost of labour flat up to the supply curve, so employment can rise.
OCR
- Specification
- We haven't recorded the exact specification point for this board yet.
- What its mark schemes look for
- Diagram marks are listed point by point: axes labelled, curves labelled with the right shift, and the old and new equilibrium marked.
Eduqas
- Specification
- We haven't recorded the exact specification point for this board yet.
- What its mark schemes look for
- The top bands reward a diagram that is accurate, well labelled and referred to in the writing. A diagram that isn't used drops a band.
WJEC
- Specification
- We haven't recorded the exact specification point for this board yet.
- What its mark schemes look for
- Axes must be labelled for the market in the question, and a question that asks for 'diagrams' expects more than one.
Cambridge International
- Specification
- 8.3.7–8.3.8 Wage determination in perfect and imperfect labour markets.
- What its mark schemes look for
- Paper 4 has asked for the minimum wage in a monopsony with an accurate, labelled diagram.
Edexcel International
- Specification
- 3.3.5 Minimum wage controls.
- What its mark schemes look for
- Show an increase in the minimum wage from one level to another, not its introduction.
With a school licence, the How often page in CueCurve lists the exam questions each board has asked that call for this diagram.
Paraphrased from published specifications, mark schemes and examiner reports. How we check
In CueCurve you can also
- Build the diagram line by line in front of the class with Step by step, so they see the order to draw it in.
- Drag the curves live and switch scenarios in one click, starting from the plain diagram each time.
- Present it full screen, draw on it with the pen, and save it into a lesson.