
Price elasticity of demand diagram
How price elasticity of demand changes along a straight demand curve, what that means for total revenue, and the perfectly elastic, perfectly inelastic and unit elastic cases.
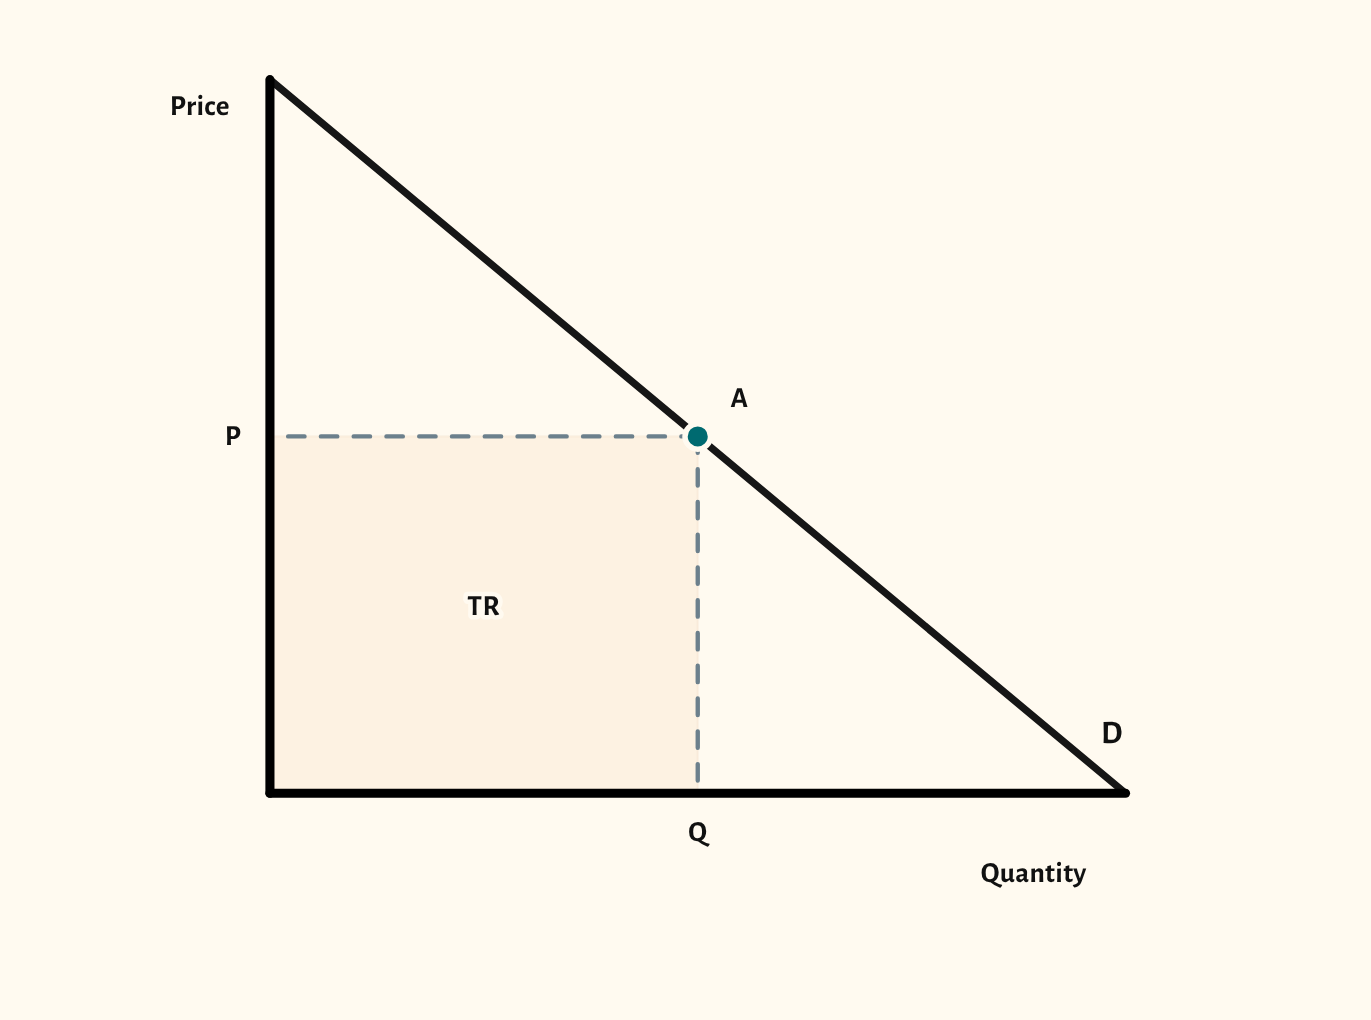
Open this scenario in CueCurve
Included in the school licence.
What the diagram shows
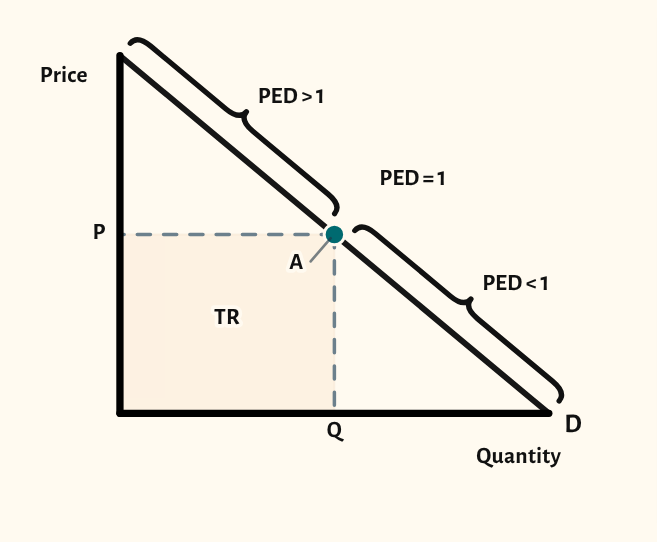
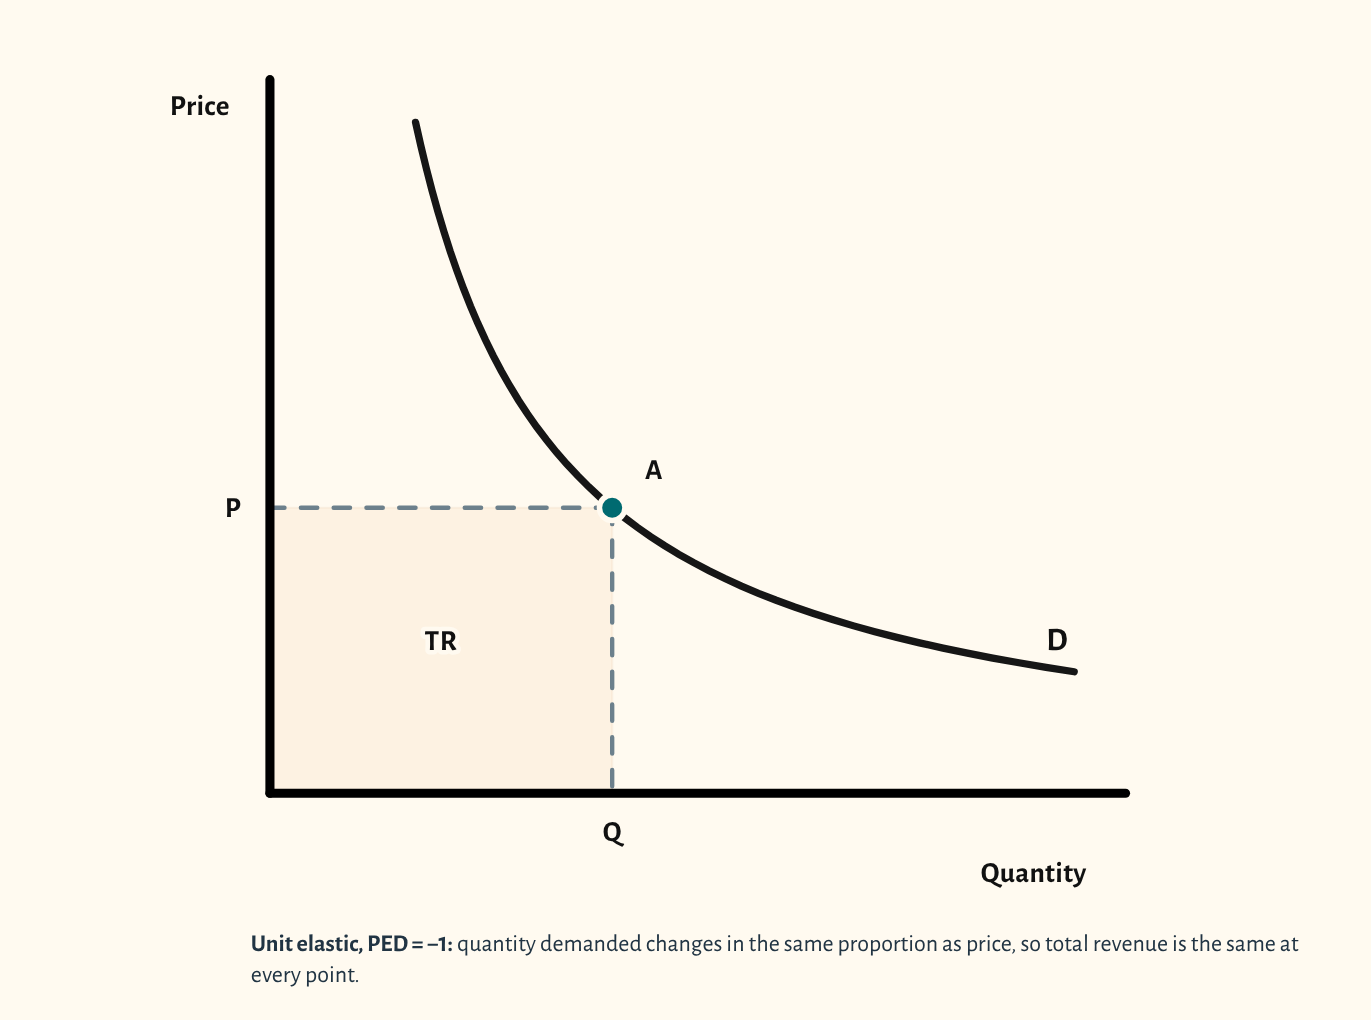
Price elasticity of demand (PED) measures how strongly quantity demanded responds to a change in price. On a straight-line demand curve the slope is the same everywhere, but PED isn't: demand is price elastic above the midpoint, unit elastic at the midpoint and price inelastic below it.
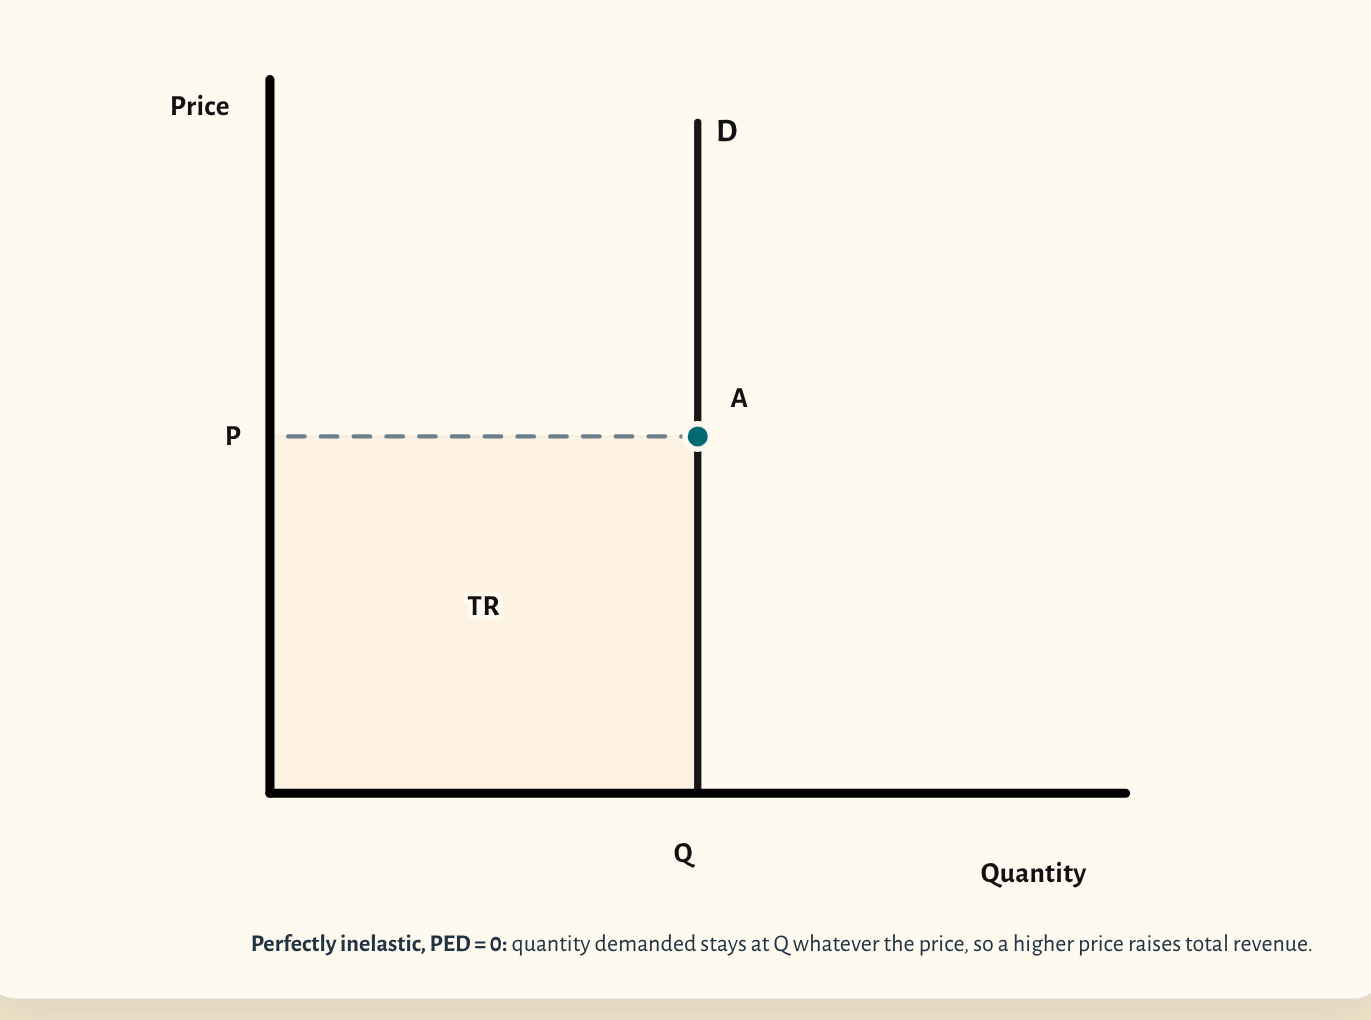
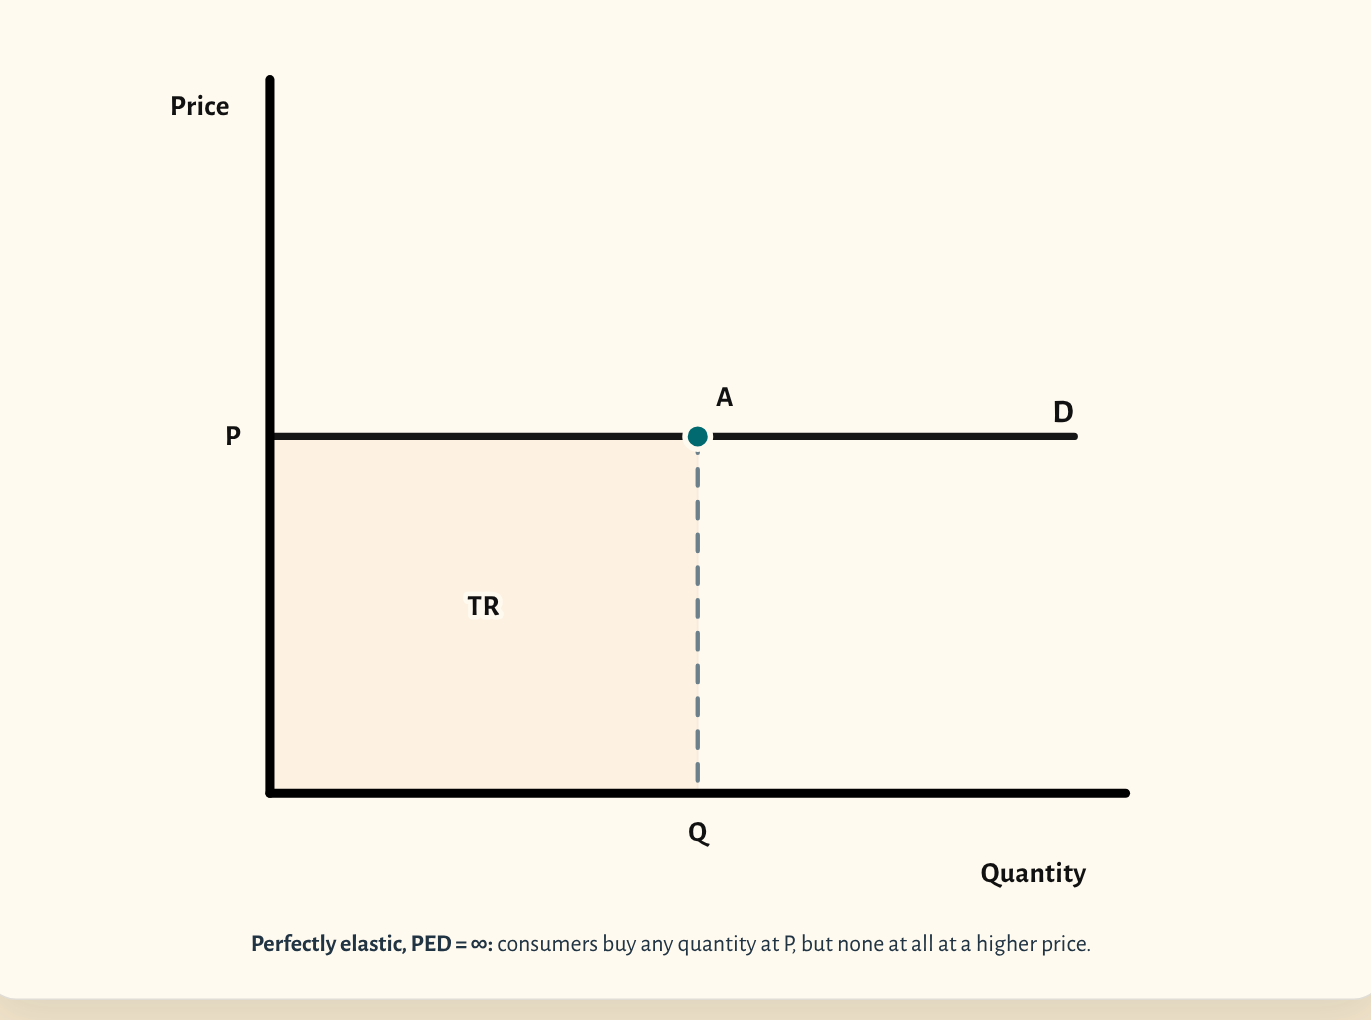
That links straight to total revenue, the price times quantity rectangle under a point. Where demand is elastic, a price cut raises total revenue; where it's inelastic, a price cut lowers it; at unit elasticity total revenue is at its highest. The extremes are drawn differently: perfectly inelastic demand is vertical, perfectly elastic demand is horizontal, and unit elastic demand is a rectangular hyperbola, not a straight line.
More scenarios
Drawing it in an exam
- Don't judge elasticity by slope alone: on a straight line, PED changes from point to point. Compare elasticity on two curves only through the same point.
- Show total revenue as a rectangle from the point to both axes, and compare the areas before and after the price change.
- Draw the extremes exactly: vertical for perfectly inelastic, horizontal for perfectly elastic, and a curve, not a straight line, for unit elasticity.
- A common slip is drawing a steep straight line and calling it unit elastic.
Your exam board
Choose your board to see where this sits in its specification and what its mark schemes look for.
Edexcel A
- Specification
- We haven't recorded the exact specification point for this board yet.
- What its mark schemes look for
- Examiners keep asking for diagrams that are accurately drawn, fully labelled and used in the answer, and a top-level essay often needs an accurate diagram.
Edexcel B
- Specification
- We haven't recorded the exact specification point for this board yet.
- What its mark schemes look for
- A diagram on its own earns at most 4 of 6 marks: the answer has to explain it. Diagrams should be fully labelled, with the original equilibrium shown.
AQA
- Specification
- We haven't recorded the exact specification point for this board yet.
- What its mark schemes look for
- Short Draw questions are marked by counting labels: both axes, every curve, and the prices and quantities. No title or grid lines are needed.
OCR
- Specification
- 2c.2.6 PED, YED, XED and PES, including diagrams of different values of PED.
- What its mark schemes look for
- Elasticity extremes drawn correctly: perfectly inelastic as a vertical line, perfectly elastic as a horizontal line, and unit elasticity as a rectangular hyperbola.
Eduqas
- Specification
- We haven't recorded the exact specification point for this board yet.
- What its mark schemes look for
- Elasticity extremes drawn correctly: perfectly inelastic as a vertical line, perfectly elastic as a horizontal line, and unit elasticity as a rectangular hyperbola.
WJEC
- Specification
- We haven't recorded the exact specification point for this board yet.
- What its mark schemes look for
- Elasticity extremes drawn correctly: perfectly inelastic as a vertical line, perfectly elastic as a horizontal line, and unit elasticity as a rectangular hyperbola.
Cambridge International
- Specification
- 2.2.4 Perfectly elastic, unitary and perfectly inelastic demand.
- What its mark schemes look for
- Elasticity extremes drawn correctly: perfectly inelastic as a vertical line, perfectly elastic as a horizontal line, and unit elasticity as a rectangular hyperbola.
Edexcel International
- Specification
- We haven't recorded the exact specification point for this board yet.
- What its mark schemes look for
- Elasticity extremes drawn correctly: perfectly inelastic as a vertical line, perfectly elastic as a horizontal line, and unit elasticity as a rectangular hyperbola.
With a school licence, the How often page in CueCurve lists the exam questions each board has asked that call for this diagram.
Paraphrased from published specifications, mark schemes and examiner reports. How we check
In CueCurve you can also
- Build the diagram line by line in front of the class with Step by step, so they see the order to draw it in.
- Drag the curves live and switch scenarios in one click, starting from the plain diagram each time.
- Present it full screen, draw on it with the pen, and save it into a lesson.